Category: Regime Change
Feb 14, 2025
in Regime Change
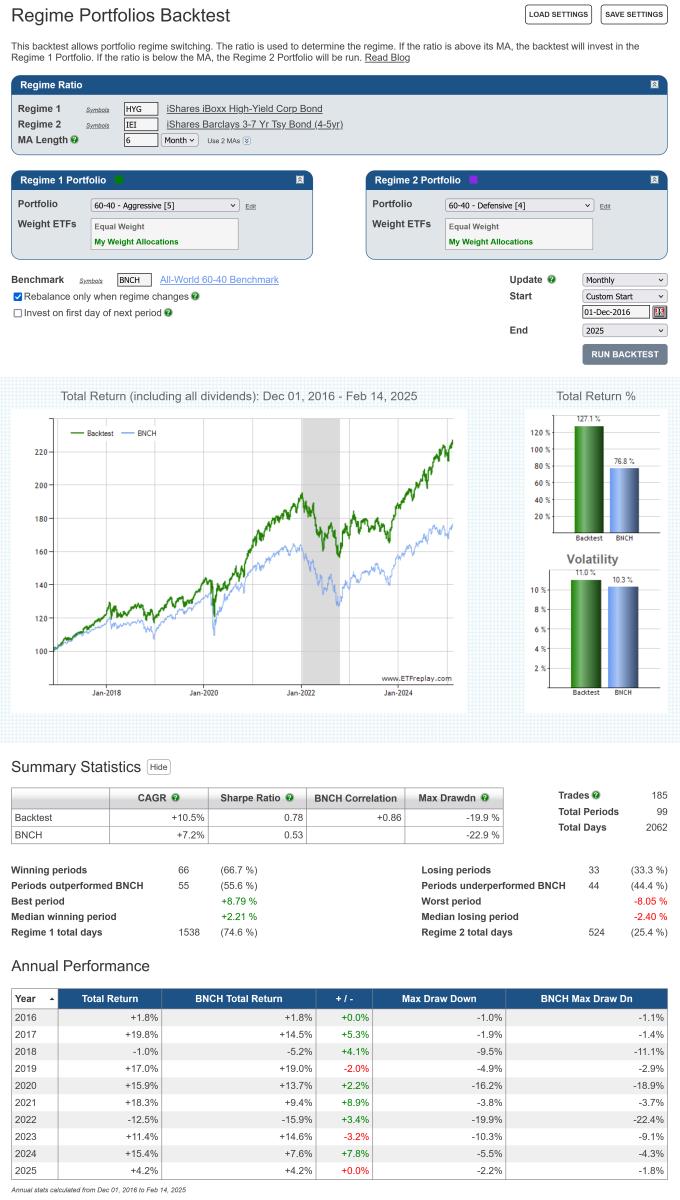
In 2016 we wrote a blog post with an example that employed a simple credit spread style ratio (HYG / IEI) as a regime indicator to switch between aggressive and defensive 60- 40 allocations.
When the High Yield / Treasury ratio was in an up trend (i.e. HYG / IEI was above its 6-month moving average) the backtest invested in the aggressive portfolio, which contained Emerging Markets, Financials, Nasdaq and High Yield ETFs. When the ratio was below its MA, the backtest switched to the defensive 60-40 portfolio that held Treasury Bonds, Utilities, Healthcare and Consumer Staples.
Below is an update of the same Regime Portfolios backtest, starting from the end date of that blog post example; December 1st, 2016.
click chart image to view full size version
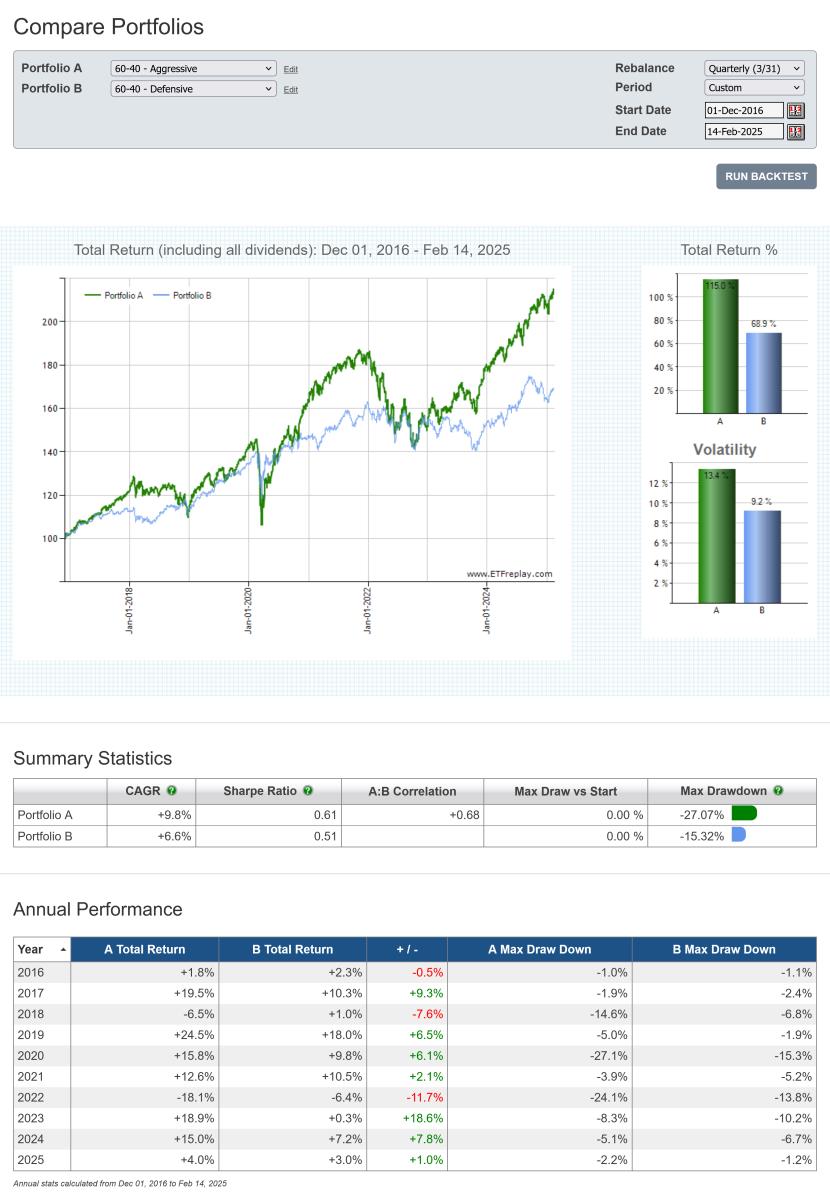
During the 9-year out-of-sample period since the original example, the regime model has been invested in the aggressive portfolio (Risk On) approximately 75% of the time. The performance of both the aggressive and defensive 60-40 portfolios, over the same time period, is displayed below.
click chart image to view full size version
As with the original blog post, this should not be viewed as a strategy to be replicated as is. Rather, its' purpose is simply to illustrate the regime change concept and to provide a starting point for subscribers to further develop with their own ideas.
See:
Regime Portfolios backest
Compare Portfolios backtest
Feb 05, 2025
in Regime Change, Sectors
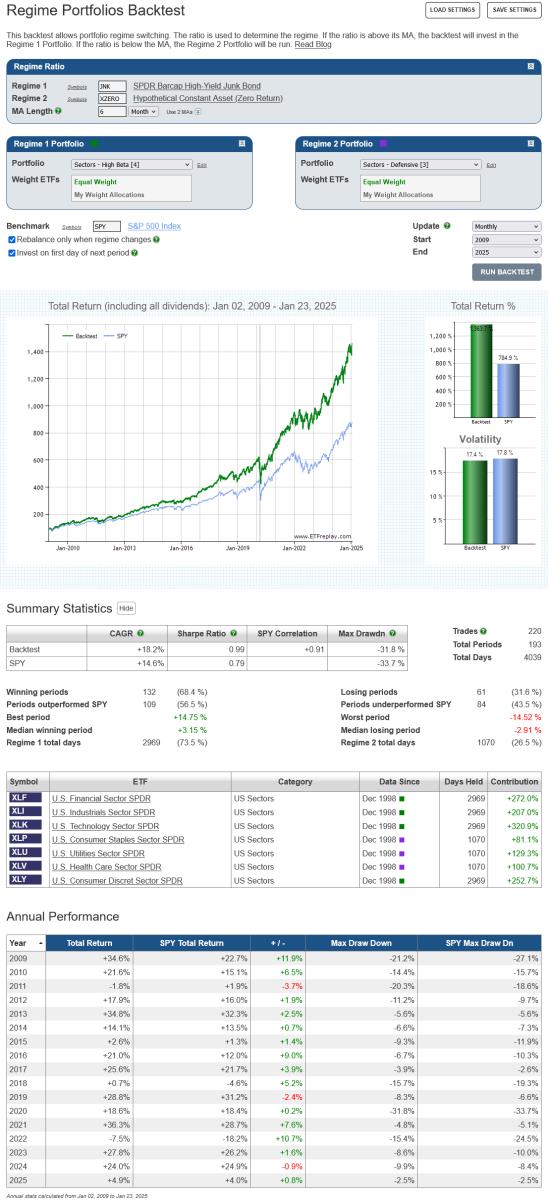
The performance of different industrial groups will vary over the course of the business cycle. Consequently, it makes sense that sector allocations be revised when there is a change in the prevailing regime.
Below is an example that uses High Yield Bonds to define the market regime.1 When JNK is trending upwards (i.e. above its MA), the backtest invests in the following high Beta sectors; Financials (XLF), Industrials (XLI), Technology (XLK) and Consumer Discretionary (XLY). Conversely, when the JNK trends down (i.e. below its MA), the backtest switches to a portfolio of low volatility defensive sectors; Consumer Staples (XLP), Utilities (XLU) and Health Care (XLV). To keep things simple, both the high Beta and low volatility portfolios are equally weighted.2
click image to view full size version
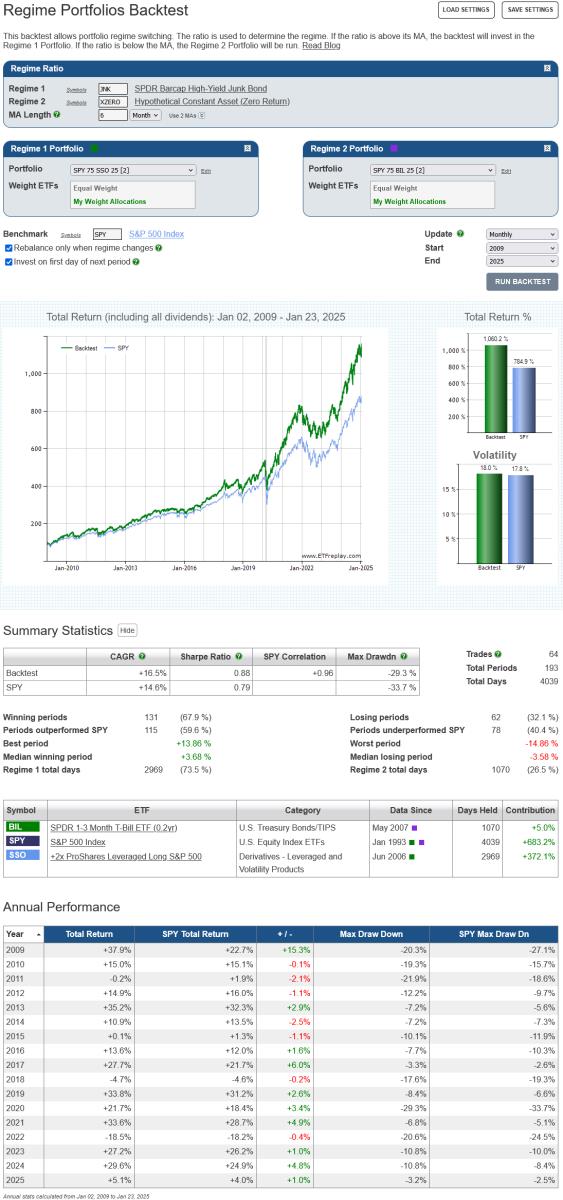
A simple alternative to choosing specific sectors from within an index (in this case the S&P 500), is to increase the leverage of the index itself when in Risk On mode or add cash when Risk Off. The following example employs the same High Yield regime, but this time the high Beta portfolio is 75% SPY and 25% SSO (2x daily S&P 500 return) and defensive portfolio is 75% SPY and 25% BIL.3
click image to view full size version
This simpler strategy produces far fewer trades. It should also be noted that as the high Beta and defensive portfolios are now just mildly levered / diluted versions of SPY, they will both be (almost) perfectly correlated with the S&P 500. While this could be considered a drawback, high-correlation to strong performing assets in up markets is consistent with Risk On strategy’s objective. The lack of diversification is less than ideal for the defensive portfolio, but the significant cash allocation will cushion losses in down markets.4
Notes:
- XZERO is simply a zero return index (i.e. it's a constant), so a 6-month MA of the ratio JNK / XZERO is the same as a 6-month moving average of JNK itself.
- An equal weight allocation will mean that sectors are over, or under, weight relative to their market capitalization weightings. Over the last 20+ years, the market cap value of the Health Care sector has been approximately 4 times that of Utilities. An allocation of XLP 35%, XLV 52% and XLU 13% would therefore be more in line with market capitalization weights.
- (75% * 1.0) + (25% * ~2.0) = ~1.25 Beta. (75% * 1.0) + (25% * ~0) = ~0.75 Beta
- Both examples employ a 6-month moving average to define the regime. When relying on any particular MA length there is always the risk that it will underperform in the future, even though it performed well in backtests. This risk can be attenuated by diversifying across a range of moving average lengths.
Apr 26, 2024
in Regime Change, RS Composite
We have added an RS Composite option to the Regime Relative Strength backtest.
Annual subscribers (both pro and regular) can now switch from using regular 3-factor RS models to RS Composite models by turning on the RS Composite option.

click image to view full size version
For more detail on the difference between the 3-factor Relative Strength model and RS Composite, see Relative Strength: 3 Factor vs Composite
Go to the Regime Relative Strength backtest
Aug 23, 2022
in Regime Change, Ratio
A question that we receive with some regularity is "can I run a backtest that changes strategy based on whether SPY is above or below its 200-day Moving Average?"
The answer is yes. We have a group of backtests that switch between strategies depending on the prevailing regime. These regime backtests build up on the logic of the Ratio MA backtest and come in 2 varieties:
With these two backtests, when the ratio is above its MA the backtest runs the Regime 1 portfolio / RS strategy (i.e. Risk On). Conversely, when the ratio is below its MA, the Regime 2 (Risk Off) portfolio is chosen.
If, rather than using a ratio, you want to switch strategy based on whether or not SPY alone is above / below its 200-day MA, then you can use XZERO as the Regime 2 security.
XZERO is simply a zero return index (i.e. it's a constant), so an MA of the ratio SPY / XZERO is the same as a moving average of SPY itself (see the Parameter Summary comparison at the bottom of this post).
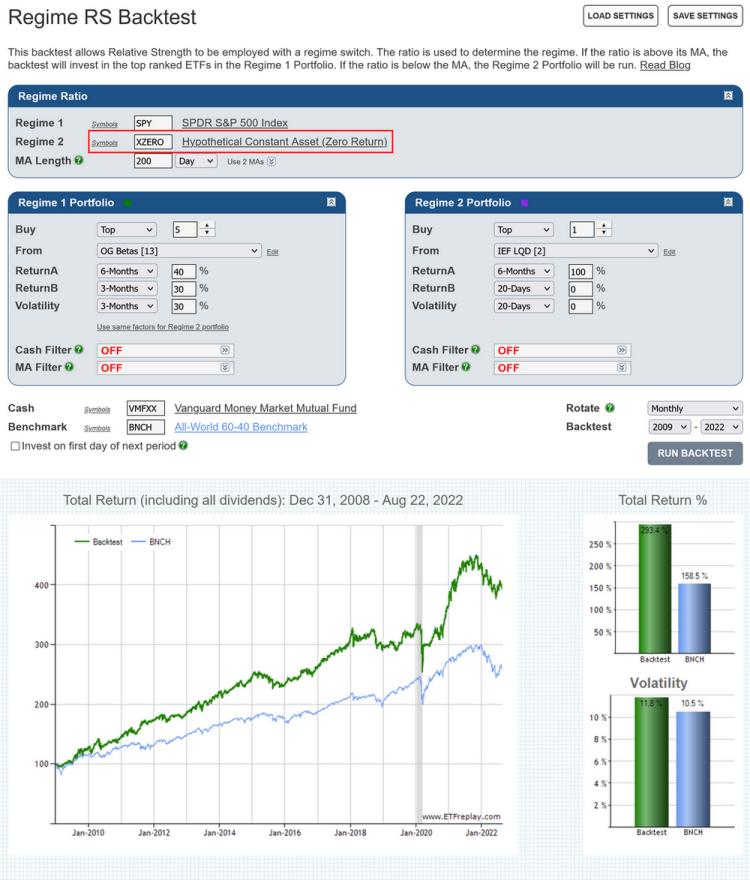
Regime RS backtest that uses the SPY 200-day MA to determine the regime
Note: Moving Averages on ETFreplay are calculated using Total Return. i.e. the calculation does not just use closing prices but also accounts for the receipt and reinvestment of any dividends and distributions. The MA is then compared to the Total Return value of the ETF, so that it's like-vs-like; everything is Total Return, not just price.
See:
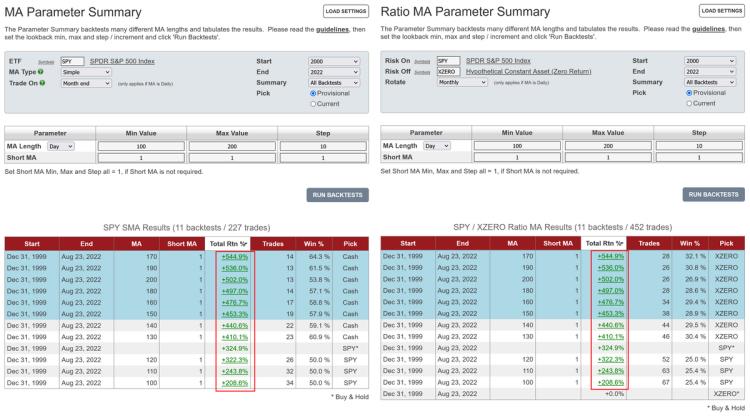
SPY MA Parameter Performance Summary on the left. SPY / XZERO Ratio MA Parameter Summary on the right. The backtest returns are the same.
Dec 09, 2021
in Relative Strength, Mean Reversion, Regime Change
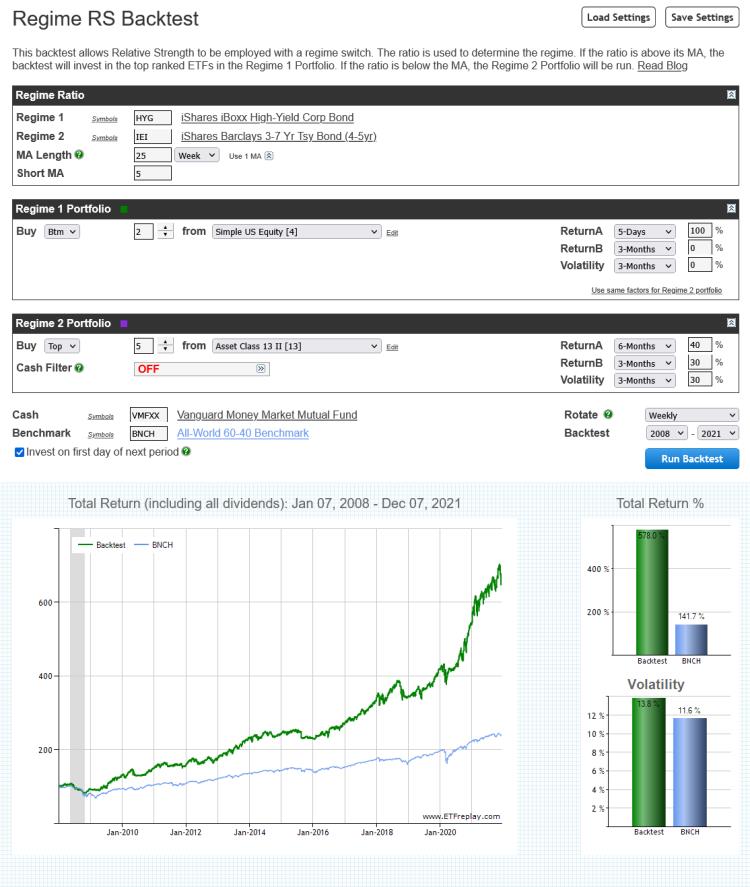
This example employs a simple credit spread style ratio to define the prevailing risk on / off regime and uses that to switch between different strategies.
When the High Yield / Treasury ratio is trending upwards (i.e. short MA above long MA) the backtest pursues a mean-reversion strategy, investing in the weakest short-term performers (buying wholesale) in a list of broad U.S. equity ETFs.
Conversely, when the HYG / IEI ratio trends down (short MA below long MA), the backtest switches to a Relative Strength strategy; buying the top five from a list of mixed asset class ETFs. Selecting the strongest five securities from the list provides some diversification while also giving the backtest the opportunity, in bear markets, to allocate 80% to fixed income and, in the most severe periods, to avoid equities entirely.
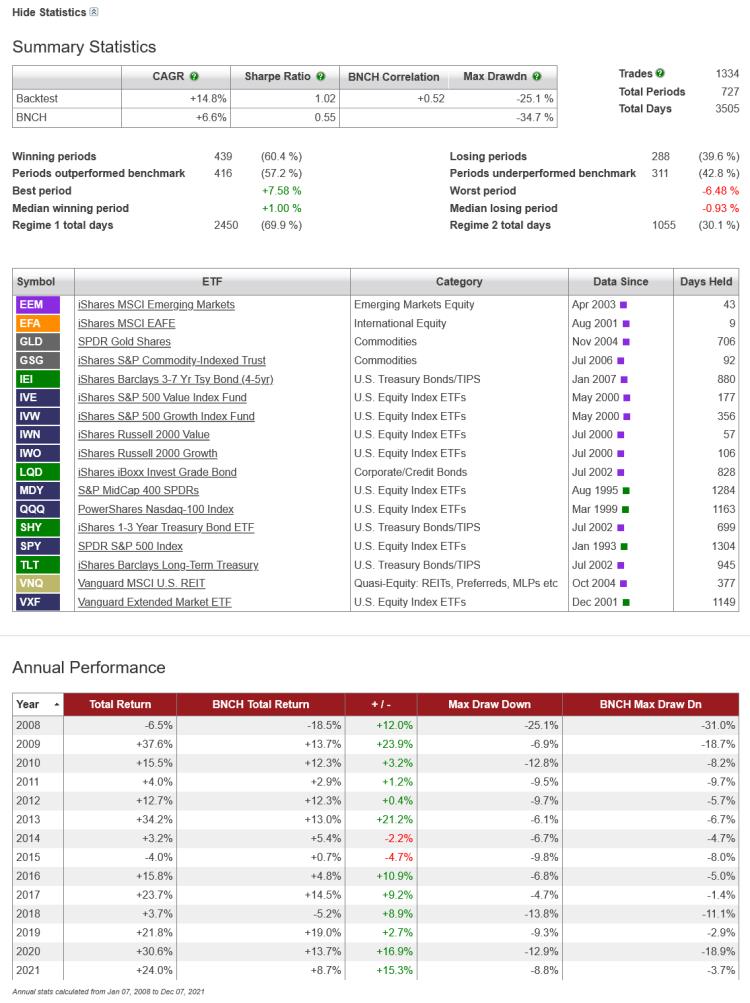
Specific parameters and ETFs are not the focus of this example, rather, it is intended to highlight the backtest functioanlity and to provide a starting point for subscribers to further research and develop.