Category: Tracking Error
Dec 16, 2022
in Tracking Error
We have added some new functionality to the Correlation tool, Advanced RS Pro backtest and the My Portfolios page.
Correlation tool
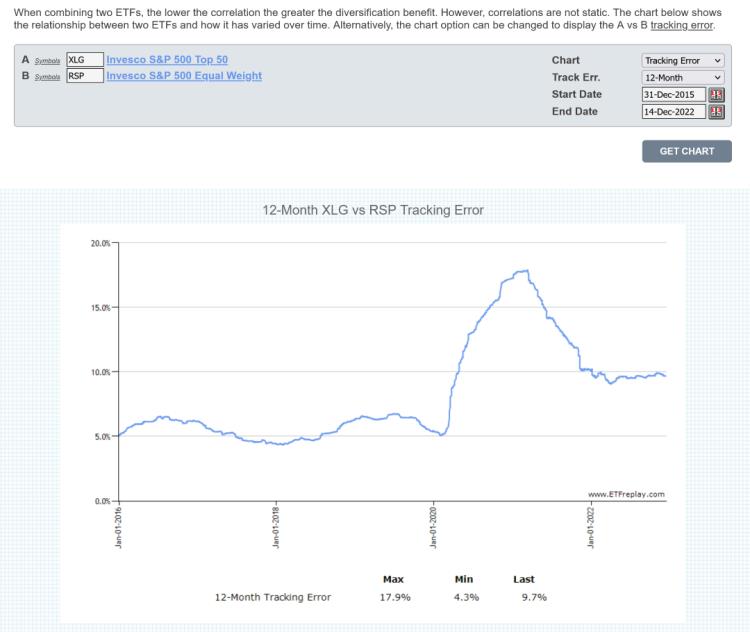
There is now an option to change the chart to display the x-period Tracking Error, making it possible to see how closely security A has tracked security B and how that tracking has varied over time.
Advanced Relative Strength Pro
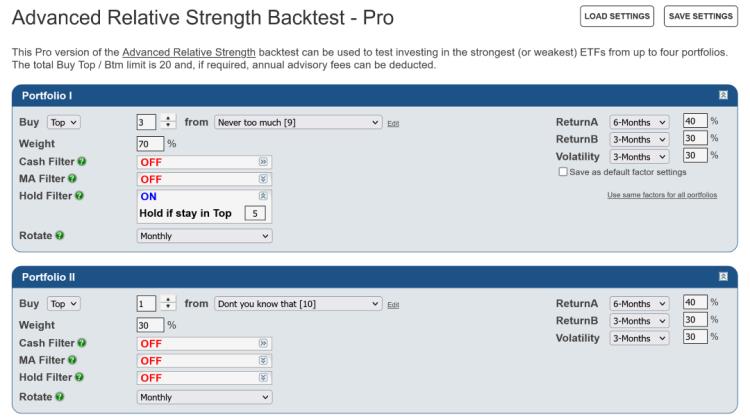
For Pro subscribers, the Hold Filter option is now available on each of the 4 portfolios of the Advanced RS Pro backtest.
Portfolios
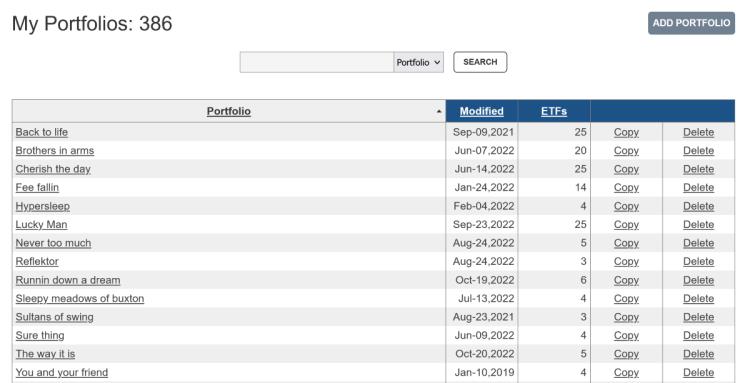
To assist subscribers that have a large number of portfolios, the My Portfolios table now has a date last modified column, which can be sorted. You can now also search for a portfolio by name, or find all your portfolios that contain a specific symbol.
Jul 05, 2022
in Backtest, Dashboards, Tracking Error
We have added some new functionality to the Core-Satellite backtest, Tracking Error tool and Dashboard.
Core-Satellite
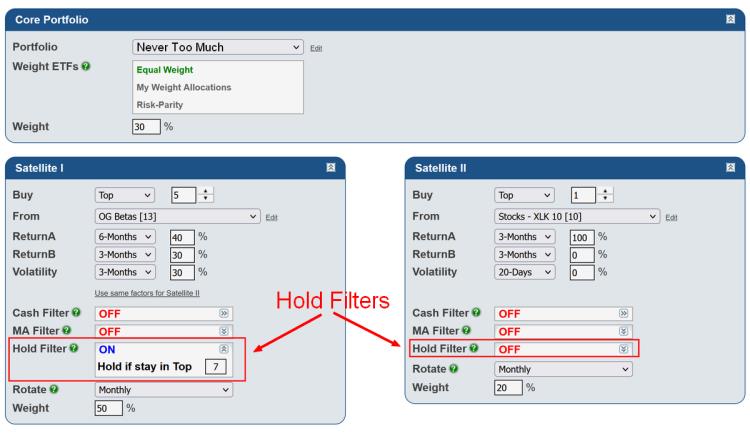
The Core-Satellite backtest has an updated look and the Hold Filter, which we recently added to the Portfolio RS and RS - Combine Portfolios, can now be applied to either (or both) of the satellites.
click image to view full size version
The appearance of the other parallel relative strength backtests, the sequential RS and various regime backtests has been similarly updated.
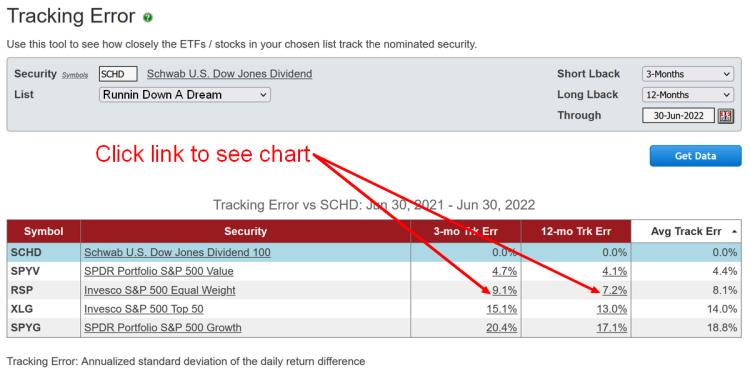
Tracking Error tool
The tracking error values now link through to the ETF charts page, which will automatically load the two securities over the specified duration and display their performance.
click image to view full size version
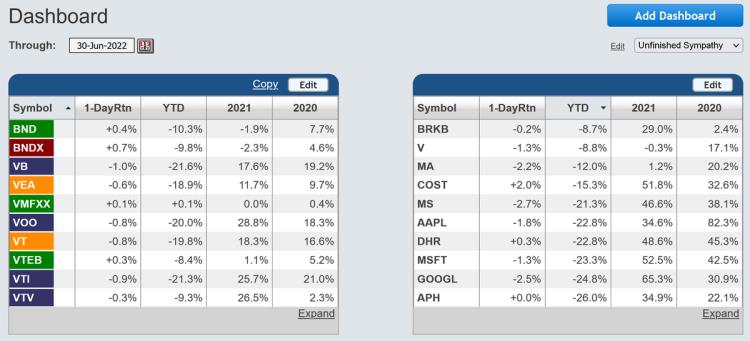
Dashboard
We recently added a new Summary window option that displays the 1-Day, Year-To-Date, 2021 and 2020 Total Return of each security in your chosen list.
click image to view full size version
Apr 10, 2022
in TRD Total Return Diff, Video, Tracking Error
Instructional video on how to use Tracking Error to improve consistency in ETF backtesting. #STUDY
to expand video on screen, click the '4 expanding arrows' icon in the bottom right corner of the video screen. Use the settings icon to change to 1080 quality if it seems at all blurry
Feb 28, 2022
in Tracking Error
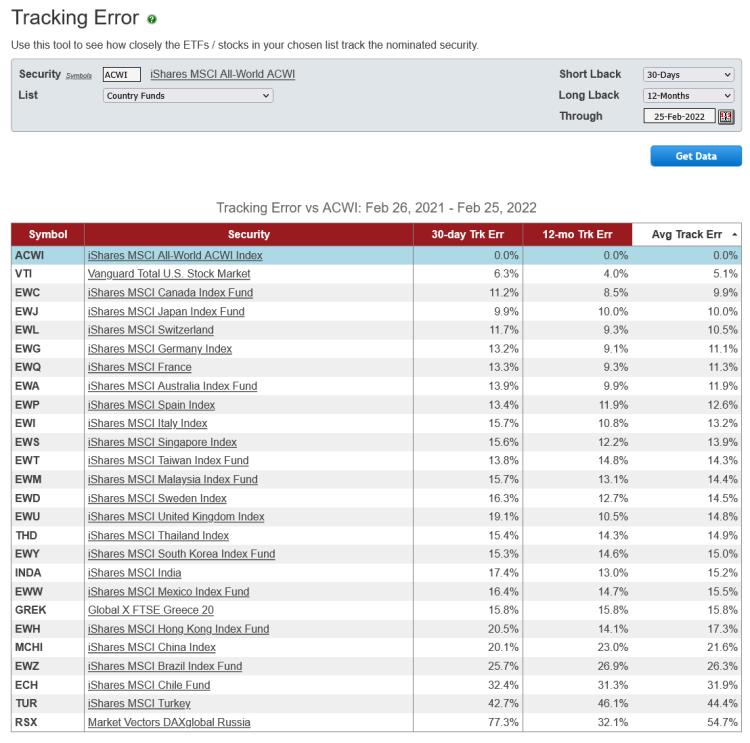
We have added a new tool that enables subscribers to see how closely the ETFs, stocks or mutual funds in their various lists track a given benchmark security.
Tracking error is the annualized standard deviation of the daily return difference between the security and the benchmark. i.e.
TE = StDev(daily total return - benchmark daily total return) x SQRT(252)
1% Tracking Error therefore means that, if returns are normally distributed, the security’s return will be within +/- 1% of the benchmark return 68% of the time and within +/- 2% of the benchmark 95% of the time.
Realized daily returns are obviously not perfectly normally distributed, so those probabilities are not to be taken literally, they are simply a rough guide. Nonetheless, tracking error provides an alternative perspective on risk from volatility and maximum drawdown.
A stock or ETF that has a persistently high tracking error will deviate substantially from the benchmark and is therefore unpredictable. This does not mean the security must automatically be excluded from the portfolio, but it would be prudent to set its position size accordingly.
Side note: The tracking error of a 2x leveraged ETF will be approximately the same as the volatility of its benchmark. i.e.
StDev (2x Daily Return - Daily Return) x SQRT(252) = StDev (Daily Return) x SQRT(252) = Volatility
SSO tracking error vs SPY ~= SPY volatility
QLD tracking error vs QQQ ~= QQQ volatility
etc.
click image to view full size version
Go to the Tracking Error tool
Nov 10, 2011
in Tracking Error
We realize we've written a number of blogs now about 'nuances' in financial analysis. This is the nature of it; you must learn some of the details involved in assumptions. It is a part of what being a financial analyst is about.
The nuance we will discuss here concerns 'tracking error.' Tracking error just means how closely the ETF price reflects the underlying portfolio value.
The way an ETF provider measures ETF tracking error and posts on their website is to calculate the midpoint of the closing bid-ask spread vs the underlying per share value of the benchmark it is tracking. The nuance here is that this is not how regular closing price is determined in your brokerage or quote service.
Closing price defaults to the last trading price of the day. So we have a mismatch. On the one hand, if you went to trade a given ETF, you obviously would get it near the bid or ask. But if you are looking at the official exchange closing price on any given day, it will be the last price -- not the closing bid-ask midpoint.
This actually has important implications in backtesting as you could have large tracking error on market price -- even if there is low tracking error as calculated by the ETF providers.
Happily, there is an easy way to adjust for this; only use data where the ETF is liquid (and WAS liquid for the backtest period under analysis). If the ETF is liquid, it will actually be trading at the end of day and the closing price and the midpoint of the closing bid-ask will be very close and so true tracking error will be small.
We will point out that in this case, it is not that the ETF providers are doing something wrong --- they are showing a good reflection of an actual trade if done at the close. It is clearly up to the financial analyst to think about this and do their own diligence. You are the one responsible for your decisions in the end -- nobody else.
Let's say an ETF only trades a few times a day -- and let's say that on a particular day the last price was 10am. Then let's say the underlying index moved materially up or down into the close -- the closing price would reflect the 10am price -- despite clearly not being a true price you could trade -- and note that this difference would NOT be considered 'tracking error' because that is determined by the midpt of the closing bid-ask. But there clearly will be substantial tracking error using closing price data when the security is illiquid.
Again, there is a simple solution to this --- only use data where there there is substantial liquidity. We have hundreds of choices of liquid ETFs that have been liquid for many years now -- you don't have to bother with the 8th US Consumer Discretionary ETF that is slightly different than the first 7 but trades no volume. The data won't be any good. If its a valid investment -- 9 times out of 10 it will get to liquidity relatively quickly. If you want to use less liquid ETFs, that is fine so long as you understand the difference. Take pride in understanding these nuances, for it's part of being a good analyst.
Related to this topic, take note that we've listened to user requests and added a page to show New Additions to ETFreplay. We will continue to add any ETF that trades at least some level of volume. For what its worth, ETFreplay already covers >98% of overall ETF/ETN assets and >98% of the volume traded. The bottom 400 ETFs (some of which we do include if they are interesting new products) make up about 1% of overall ETF/ETN industry assets. There are plenty of choices already. Other than the handful of innovative new ETFs that come out every 6-12 months, focus your efforts on the existing liquid ones.