Category: Sectors
Feb 05, 2025
in Regime Change, Sectors
The performance of different industrial groups will vary over the course of the business cycle. Consequently, it makes sense that sector allocations be revised when there is a change in the prevailing regime.
Below is an example that uses High Yield Bonds to define the market regime.1 When JNK is trending upwards (i.e. above its MA), the backtest invests in the following high Beta sectors; Financials (XLF), Industrials (XLI), Technology (XLK) and Consumer Discretionary (XLY). Conversely, when the JNK trends down (i.e. below its MA), the backtest switches to a portfolio of low volatility defensive sectors; Consumer Staples (XLP), Utilities (XLU) and Health Care (XLV). To keep things simple, both the high Beta and low volatility portfolios are equally weighted.2
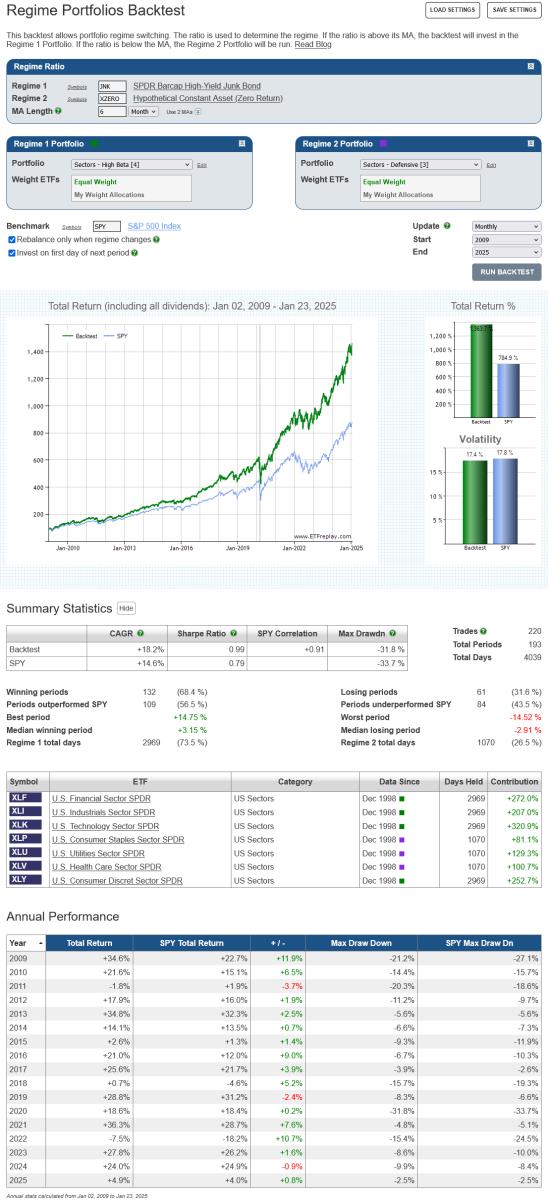
click image to view full size version
A simple alternative to choosing specific sectors from within an index (in this case the S&P 500), is to increase the leverage of the index itself when in Risk On mode or add cash when Risk Off. The following example employs the same High Yield regime, but this time the high Beta portfolio is 75% SPY and 25% SSO (2x daily S&P 500 return) and defensive portfolio is 75% SPY and 25% BIL.3
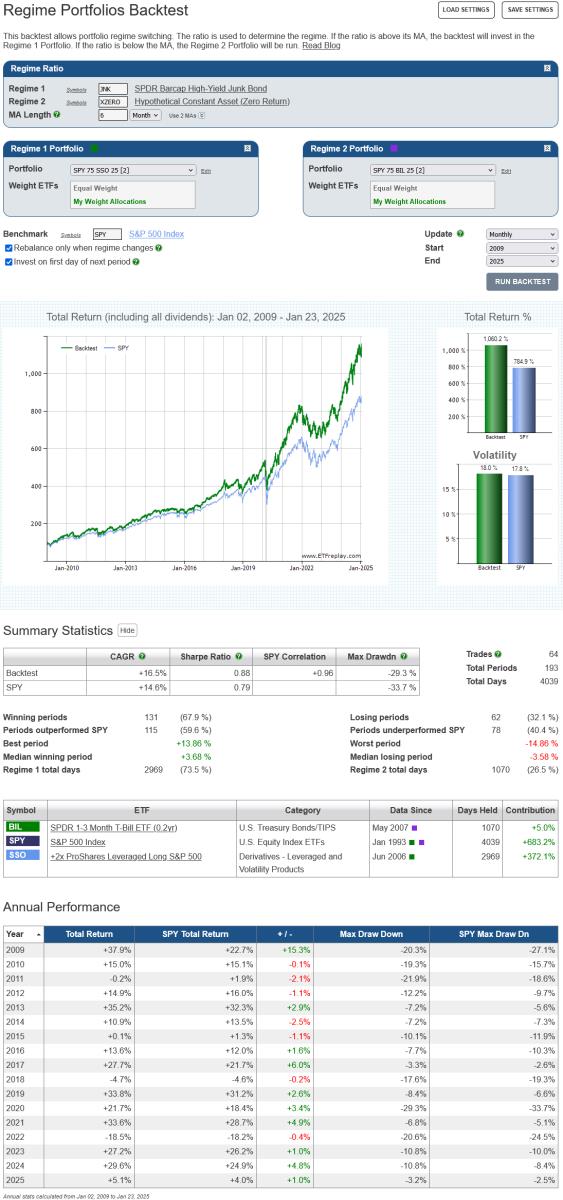
click image to view full size version
This simpler strategy produces far fewer trades. It should also be noted that as the high Beta and defensive portfolios are now just mildly levered / diluted versions of SPY, they will both be (almost) perfectly correlated with the S&P 500. While this could be considered a drawback, high-correlation to strong performing assets in up markets is consistent with Risk On strategy’s objective. The lack of diversification is less than ideal for the defensive portfolio, but the significant cash allocation will cushion losses in down markets.4
Notes:
- XZERO is simply a zero return index (i.e. it's a constant), so a 6-month MA of the ratio JNK / XZERO is the same as a 6-month moving average of JNK itself.
- An equal weight allocation will mean that sectors are over, or under, weight relative to their market capitalization weightings. Over the last 20+ years, the market cap value of the Health Care sector has been approximately 4 times that of Utilities. An allocation of XLP 35%, XLV 52% and XLU 13% would therefore be more in line with market capitalization weights.
- (75% * 1.0) + (25% * ~2.0) = ~1.25 Beta. (75% * 1.0) + (25% * ~0) = ~0.75 Beta
- Both examples employ a 6-month moving average to define the regime. When relying on any particular MA length there is always the risk that it will underperform in the future, even though it performed well in backtests. This risk can be attenuated by diversifying across a range of moving average lengths.
Jan 06, 2021
in Sequential RS, Sectors
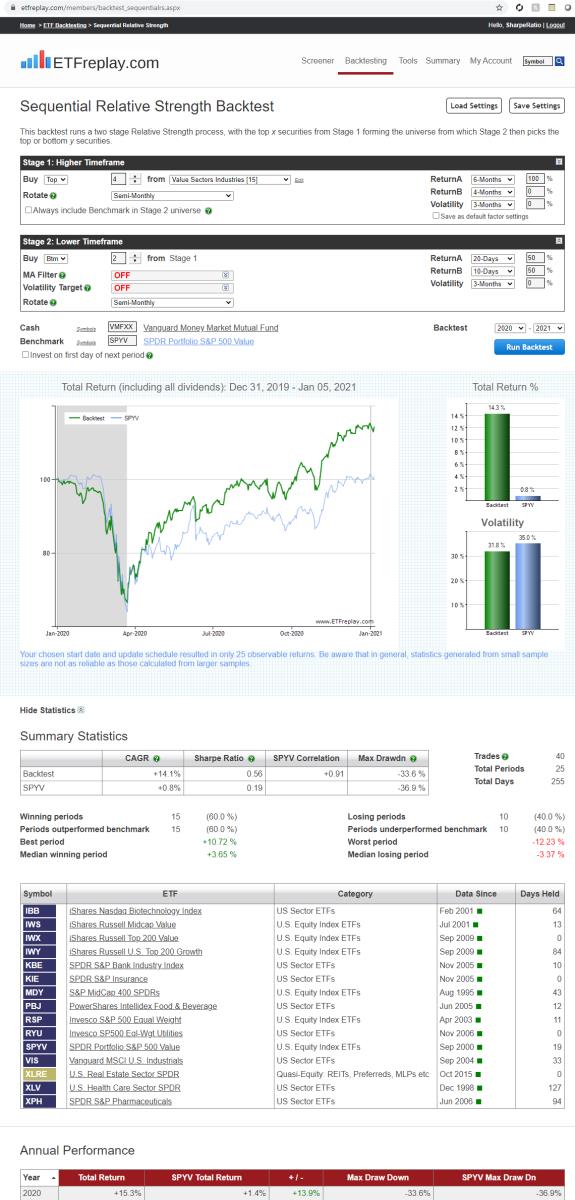
Relative strength is for segments of the market -- it is not for Growth Stocks or Tech ETFs only, it works for all sorts of things. Below are some value ETF ideas. We have found mixing something like Growth or Value with CORE etfs as well will keep it more mainstream. Up to the user to decide how much deviation from the market indexes they are comfortable with -- below is a starter idea. Note that while many may not equate IBB with value, its simply a fact that the large biotech stocks that are in IBB are also in the value indexes and therefore its more of a 'biotech-pharma' value ETF.
Nov 05, 2020
in Sequential RS, Sectors
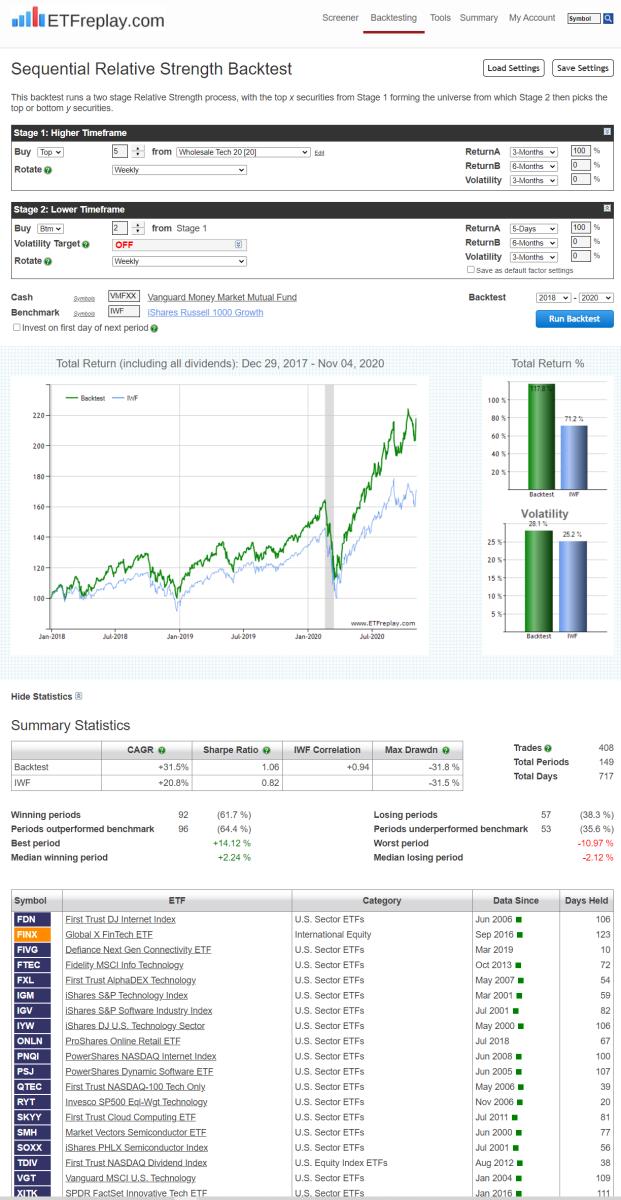
Sequential Relative Strength Is Powerful. Rather than always have the same list to go through, it automatically ranks a list and then only uses that sublist to choose from in a 2nd ranking... Keep in mind that over past few years you have still 'lost' money nearly 40% of the time -- so don't think that this is super easy to actually execute. It never seems like that... But keep working at finding good lists and making good entries and over time you will outperform and if you outperform an index that does well, you can do really well.
Aug 29, 2017
in Trend Quadrants, Sectors
Let's look back to 2016 and the market environment in the lead-up to the U.S. presidential election. What were the market conditions telling you?
Is the market moving TOWARD higher-beta, risky, higher-return-but-more-volatile assets? Or is it moving AWAY from those and into lower volatility, lower risk, safer assets? This is what actually matters.
If you take a snapshot of the market 3 months prior to the election, you can see various risky assets in 'Reverse Up' position. That is, their 6-month returns were up while the previous 6 months had been down. We can view this on our ETF Trend Quadrants module (located on the ETF Tools page):

Here is the position 1 month prior to Election Day. Note ETFs here are moving to the right. This represents money flows IN.

And then we align 2 browser windows to show Election Day and 1 month after:

Let's also cross-reference this thesis by looking at the credit markets, High-yield bonds vs Treasuries in ratio moving average form:

From 2014 into early 2016, high-yield bonds had under-performed treasuries materially. But a sharp V-spike reversal occurred in this ratio in early 2016. It was not unreasonable to think a new period of risk-on was possible if not likely given the 2014-16 relative drawdown.
The point of all this is NOT that these ETFs predicted the election. They didn't. The point is that the market conditions were bullish and this was visible in looking at the many intra-market relationships via ETFs. Sometimes the markets will whipsaw around in a tricky trading range -- but often times the markets follow the flows and 2016-17 is a real nice example of this.
Our Twitter feed on November 9, 2016 made this point as well:
