Category: RS Composite
Jan 02, 2025
in RS Composite
With any parameter based model the risk always exists that a single particular value will underperform in the future, even though it performed well in backtests.
Below is the Parameter Summary of a Relative Strength model that invests in the strongest (i.e. top 1) security from a list of 4 U.S. equity ETFs (QQQ, SCHD, SPYG and SPYV). For the 10-years through 2023, the highest Total Return was produced by the 2-month lookback length.
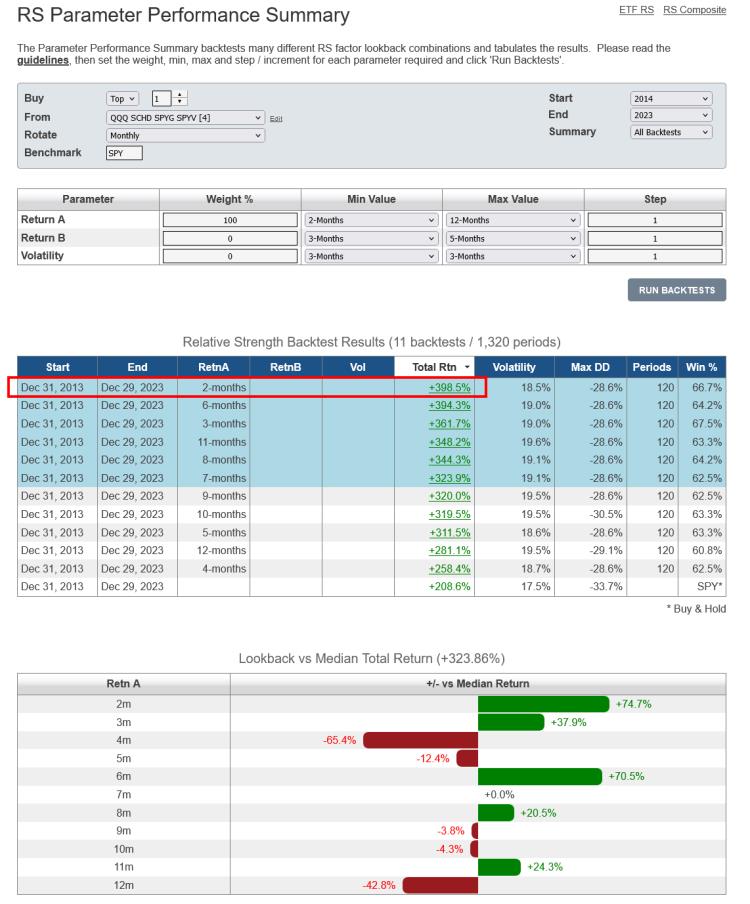
click image to view full size version
During 2024, however, the 2-month lookback was the second worst performer.
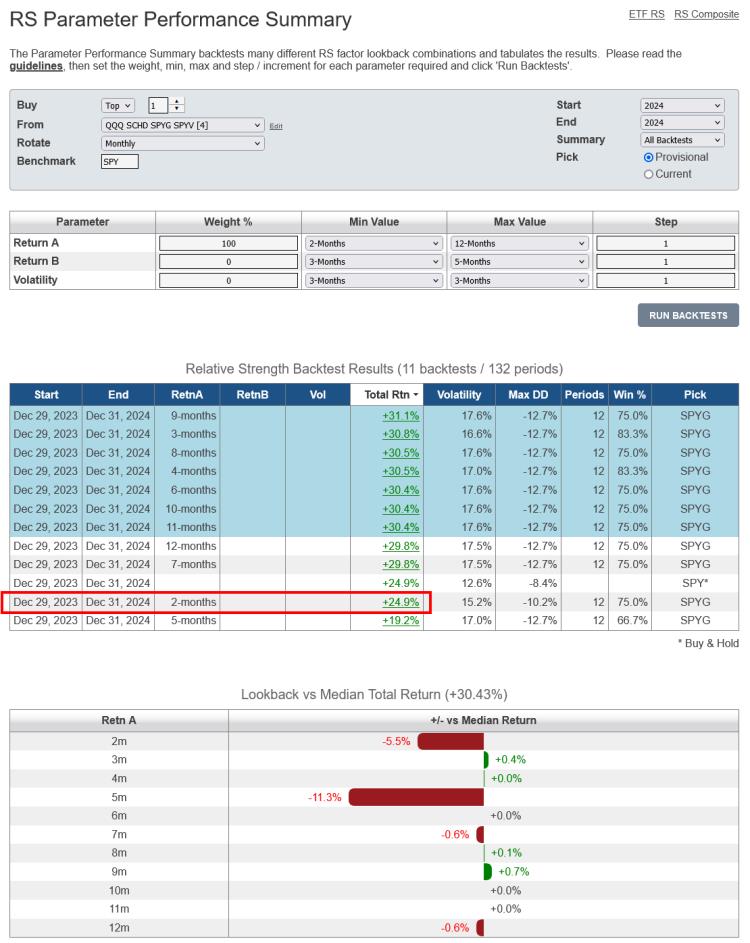
click image to view full size version
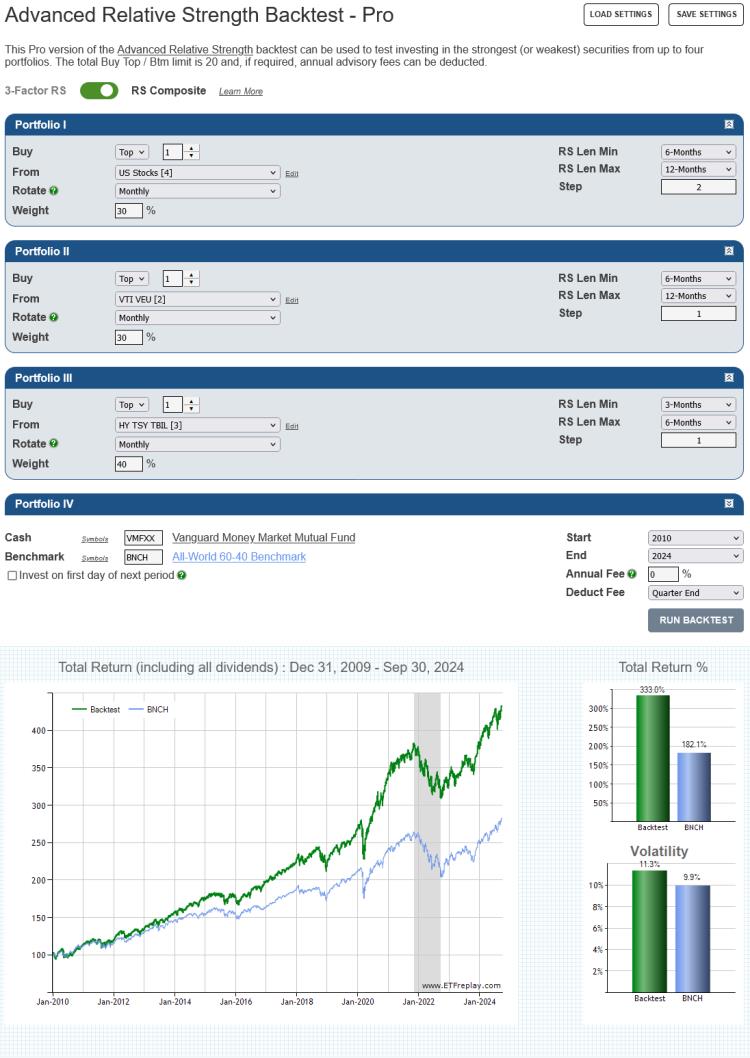
The RS Composite method, which we introduced in early 2023, hedges against this uncertainty by diversifying across a range of parameter values. For example, below is an RS Composite backtest where the minimum lookback length is 2-months, the maximum lookback is 12-months and the step value is 2. This means that, each month, rather than investing is just the top ETF ranked by 2-month returns, the composite backtest will invest 16.67% in each of the:
- top ETF from QQQ, SCHD, SPYG and SPYV ranked by 2-month returns
- top ETF ranked by 4-month returns
- …6-month returns
- …8-month returns
- …10-month returns
- top ETF ranked by 12-month returns
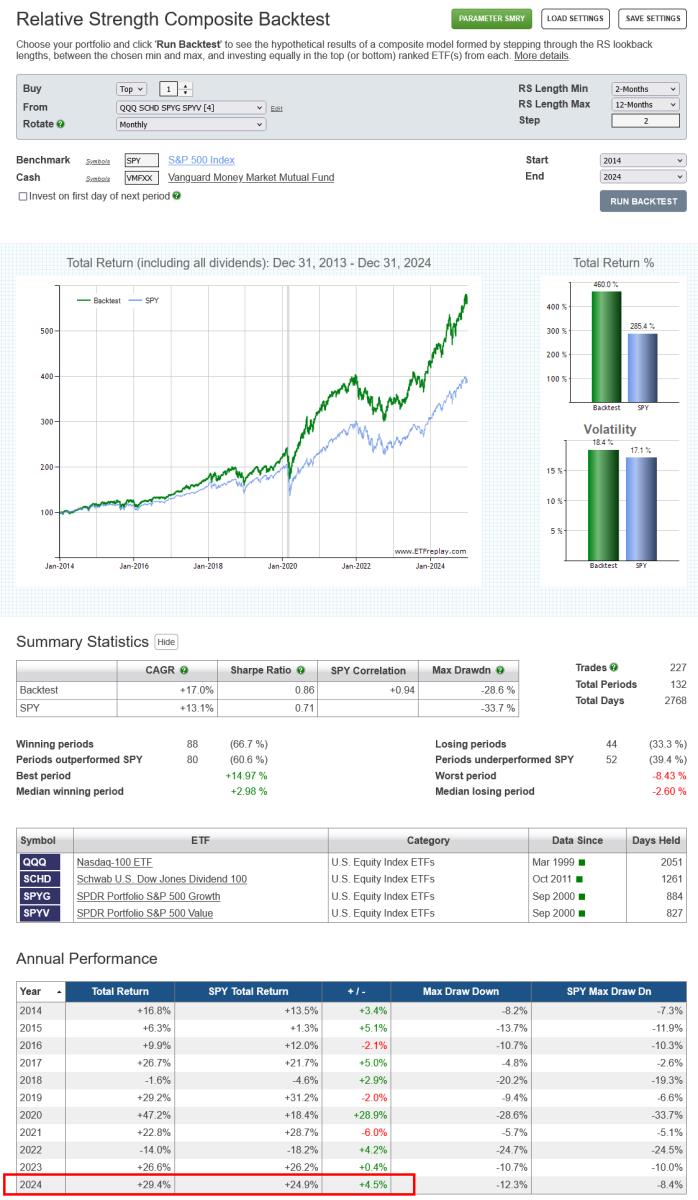
click image to view full size version
As can be seen, whereas the 2-month single lookback strategy was comparatively underwhelming in 2024, the RS Composite model performed rather well.
For more, watch this video: Using Parameter Summaries and Composite Relative Strength
Notes:
- a composite model will always underperform the single best parameter value, but, as demonstrated, it avoids being exclusively in the worst performer.
- Studying the Parameter Performance Summary guidelines is always highly recommended
Oct 08, 2024
in RS Composite
We have upgraded the Core-Satellite, Core-Regime RS and Advanced RS Pro backtests.
Core-Satellite backtest
Annual subscribers, both pro and regular, now have the option to switch between employing 3-factor Relative Strength or RS Composite on the Core-Satellite backtest.
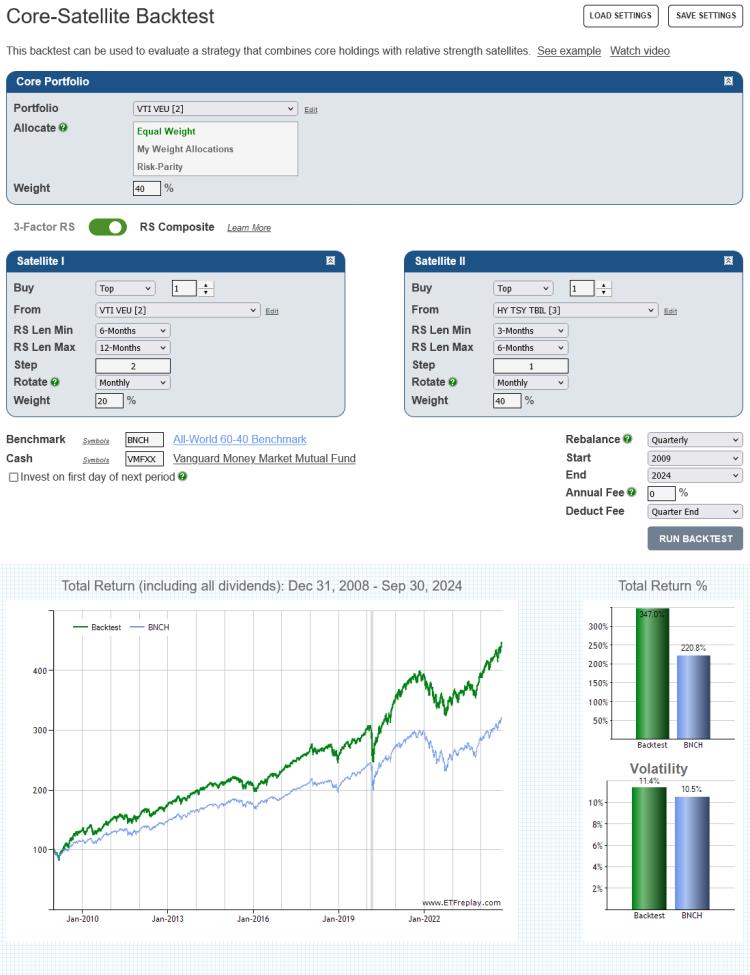
click image to view full size version
For more detail on the difference between the 3-factor Relative Strength model and RS Composite, see Relative Strength: 3 Factor vs Composite
Core-Regime RS and Advanced RS Pro
For Pro subscribers, the option to switch between 3-factor RS and RS Composite is now also available on both the Core-Regime RS and Advanced RS Pro backtests.
click image to view full size version
Apr 26, 2024
in Regime Change, RS Composite
We have added an RS Composite option to the Regime Relative Strength backtest.
Annual subscribers (both pro and regular) can now switch from using regular 3-factor RS models to RS Composite models by turning on the RS Composite option.

click image to view full size version
For more detail on the difference between the 3-factor Relative Strength model and RS Composite, see Relative Strength: 3 Factor vs Composite
Go to the Regime Relative Strength backtest
Apr 25, 2024
in Relative Strength, RS Composite
The range of Relative Strength tools and backtests on ETFreplay come in two varieties: 3 Factor and Composite.
3 Factor Relative Strength

The Relative Strength (RS) model employed by the Screener, RS Reader and the majority of RS backtests is loosely based on the Sharpe Ratio, which measures return per unit of risk. However, while the Sharpe Ratio effectively equally weights the time period for return and volatility, the RS model takes the Sharpe Ratio concept and decomposes it into three separate factors:
- ReturnA - Higher timeframe total return
- ReturnB - Lower timeframe total return
- Volatility
Volatility is a measure of risk and is the annualized standard deviation of daily returns over the specified lookback period. Risk is uncertainty and the larger the range of possible outcomes, the higher the volatility will be and therefore the greater the risk. Consequently, unlike returns, it is ranked low to high. Therefore, the greater the weight assigned to volatility, the more volatile ETFs are penalized. 1
From these three factors, and the weights assigned to them, the overall rank is calculated. The precise process is fully explained in How The Screener Works.
Both the lookback periods and the weight of each factor can be changed. For example, to rank the ETFs by only 6-month total return, set Return A to '6-Months' and set its weight to 100% (and the weights of ReturnB and Volatility to zero).
As with most models, the shorter the lookback periods chosen, the more responsive to changes the RS model will be. However, this also means that it is more likely to be whipsawed by noise and will have a higher trade frequency. A balance must therefore be struck. If a model proves to be too busy with a particular list, then longer looback periods should be employed to get above the noise (or greater weight assigned to the higher timeframe).
i.e. A model using 6-month ReturnA and 3-month ReturnB will produce less trades than 3-Month and 20-day etc.
The performance of a model can be evaluated using one of the various Relative Strength backtests and the Parameter Performance Summary makes it possible to test numerous different parameter combinations in one go. 2
Relative Strength Composite

The RS Composite model is designed to protect against the possibility of parameter choice misfortune, which can arise when relying on a single lookback period for relative strength.
i.e. though a particular lookback may have historically outperformed other lookback lengths, there's always the possibility that it may underperform in the future.
The RS composite model reduces that risk by diversifying across a range of return lengths. It does this by stepping through the lookback periods, from a specified minimum to maximum, and invests in the top (strongest) x securities from each of those. 3
By using a range of RS lengths, the composite model entirely avoids the risk of being exclusively in, what could transpire to be, the worst performing model variant.
See:
Notes:
- As an extreme example: use the Screener and set the Volatility weight to 100% (ReturnA and ReturnB weights to zero) and the least volatile ETFs will appear at the top of the list.
- Reading the Parameter Performance Summary guidelines is highly recommended
- It is also possible to backtest Mean Reversion, by investing in the bottom (weakest) x securities.
Feb 16, 2024
in Backtest, Relative Strength, RS Composite
The ETF Relative Strength backtest, which is free to use, now offers the option to backtest either regular 3-Factor RS models or Relative Strength Composite models.
With Relative Strength Composite, rather than relying on a single lookback period for relative strength, you can diversify across a range of RS lengths and thereby protect against parameter choice misfortune.
i.e. though a particular lookback may have historically outperformed other lookback lengths, there's always the possibility that it may underperform in the future.
The RS composite model reduces that risk by stepping through the lookback periods, from your chosen minimum to maximum, and invests in the top (strongest) of the 3 securities from each of those.
In the example below the minimum RS length is 3-months, the maximum is 12-months and the step value is 1. This means that, each month, the backtest will invest 10% in each of the:
- Top ETF from QQQ, MDY and SPY ranked by 3-month total return
- Top ETF from QQQ, MDY and SPY ranked by 4-month total return
- …5-month total return
- …6-month total return
- …7-month total return
- …8-month total return
- …9-month total return
- …10-month total return
- …11-month total return
- Top ranked ETF from QQQ, MDY and SPY ranked by 12-month total return

click image to view full size version
If QQQ ranks top for all 10 of those specified RS lookback periods, then 100% will be invested in QQQ. If SPY ranks top for 11 and 12-month returns and QQQ for the others, then 80% will be invested in QQQ and 20% in SPY. etc etc.
The step value can be increased to determine whether it is possible to obtain sufficient diversification without needing to employ every RS length. For instance, raising the step value to 3 in the above example will mean the backtest ranks QQQ, MDY and SPY by 3, 6, 9 and 12-month returns each month and invests 25% in the top ranked security from each of those.
To backtest just 6 and 12-month RS lengths, set RS Length Min to 6-months, Max to 12-months and Step to 6. The backtest will then, each month, rank QQQ, MDY and SPY by 6 and 12-month returns and invests 50% in the top ranked security from each.
Go to the ETF Relative Strength backtest
Not a subscriber? Subscribe
Note:
- All returns on ETFreplay are Total Return, which accounts for price appreciation and the receipt and reinvestment of dividends (and any other distributions, such as capital gains distributions). See Total Return vs Price Return
-
Subscribers, when logged in, have the option to switch from backtesting relative strength to mean-reversion and are not restricted to the 11 symbols provided for ETF 1, 2 and 3. Annual subscribers (regular and pro) also obviously have access to the fully fledged portfolio RS Composite backtest.