How to monitor a moving average strategy
Jun 20, 2024
in Dashboards, Moving Average, Timeline
Q. "How can I check for moving average crossovers on the ETFs in my portfolio each month?”
A. To monitor a moving average model you can use either the Portfolio MA Timeline or set up a Dashboard.
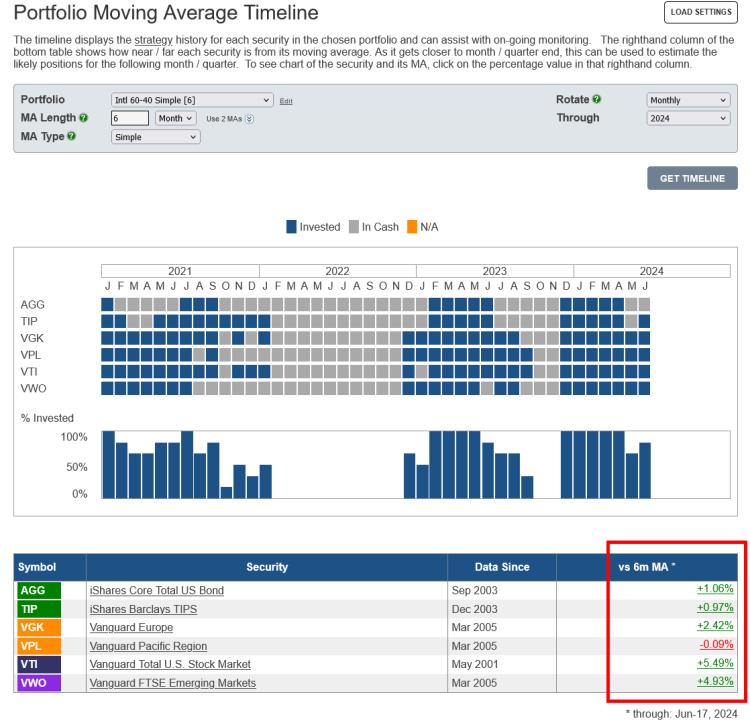
click image to view full size version
While the Timeline’s main graphic displays the invested history of each security in the portfolio, the far right column of the data table shows how near / far each ETF currently is from the chosen MA. As it gets closer to the end of the month, this can be used to estimate the likely positions for the following month. Clicking on the percentage value in that column will produce a pop-up window that displays a chart of the ETF and its moving average.
Alternatively, rather than using the Timeline, you can create a Dashboard and then add :
- MA List - displays the vs MA % for each ETF in your portfolio.
- MA Chart - vs MA % will be displayed on the chart
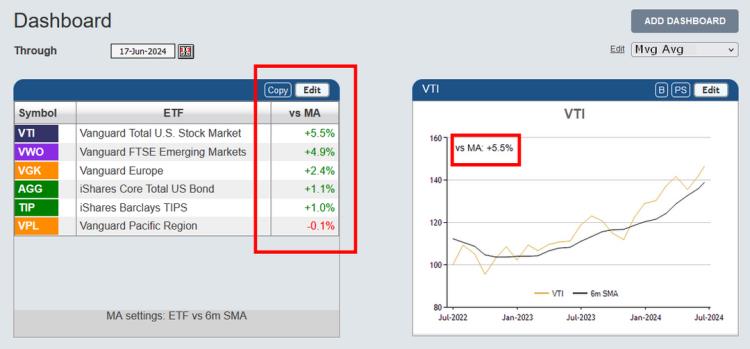
click image to view full size version
See: Introducing Dashboards: A Way To Help Organize Workflow In Research & ETF Portfolio Backtesting
Notes:
-
Moving Averages on ETFreplay are calculated using Total Return. i.e. the calculation does not just use closing prices but also accounts for the receipt and reinvestment of any dividends and distributions. The MA is then compared to the Total Return value of the ETF, so that it's like-vs-like; everything is Total Return, not just price. See the FAQ How are moving averages calculated?
-
Timelines are also available for Portfolio Ratio MA and Channel models.
Follow ETFreplay on
