Jul 05, 2022
in Backtest, Dashboards, Tracking Error
We have added some new functionality to the Core-Satellite backtest, Tracking Error tool and Dashboard.
Core-Satellite
The Core-Satellite backtest has an updated look and the Hold Filter, which we recently added to the Portfolio RS and RS - Combine Portfolios, can now be applied to either (or both) of the satellites.
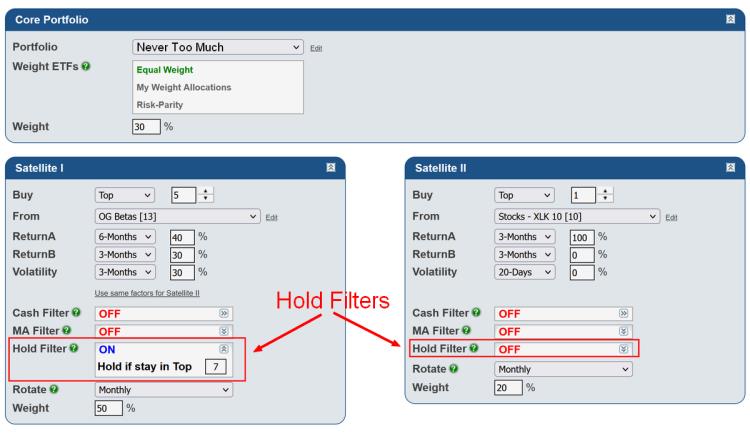
click image to view full size version
The appearance of the other parallel relative strength backtests, the sequential RS and various regime backtests has been similarly updated.
Tracking Error tool
The tracking error values now link through to the ETF charts page, which will automatically load the two securities over the specified duration and display their performance.
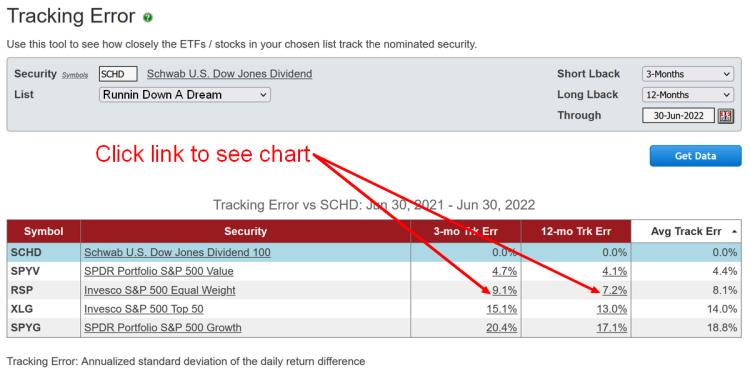
click image to view full size version
Dashboard
We recently added a new Summary window option that displays the 1-Day, Year-To-Date, 2021 and 2020 Total Return of each security in your chosen list.
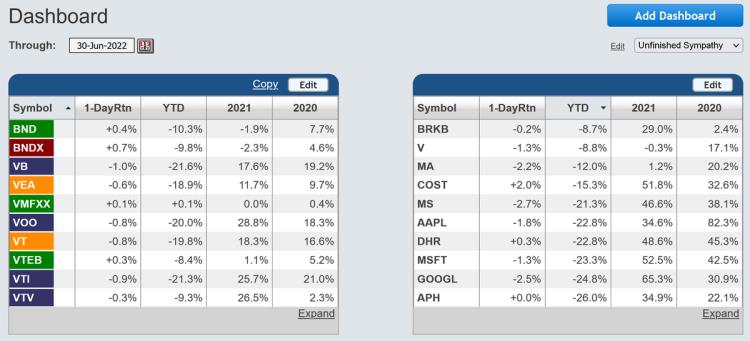
click image to view full size version
Apr 10, 2022
in TRD Total Return Diff, Video, Tracking Error
Instructional video on how to use Tracking Error to improve consistency in ETF backtesting. #STUDY
to expand video on screen, click the '4 expanding arrows' icon in the bottom right corner of the video screen. Use the settings icon to change to 1080 quality if it seems at all blurry
Apr 05, 2022
in Backtest, Relative Strength
We have added a Hold Filter option to the Portfolio Relative Strength and RS - Combine Portfolios backtests.
When the Hold Filter is turned on, the ETFs will be held as long as they remain ranked in the top (or bottom) Y.
i.e. If you choose a Buy Top of 2 and a Hold rank of 4, then the backtest will invest in 2 ETFs, but will only rotate out of an ETF when it drops below the top 4.
Using the Hold Filter makes a model less reactive and as a consequence it reduces trade activity. By not switching each and every time a security moves in and out of the top X, it can also result in fewer whipsaws. However, the higher the hold rank number is, the less responsive to changes the model will be, so a balance must be struck.
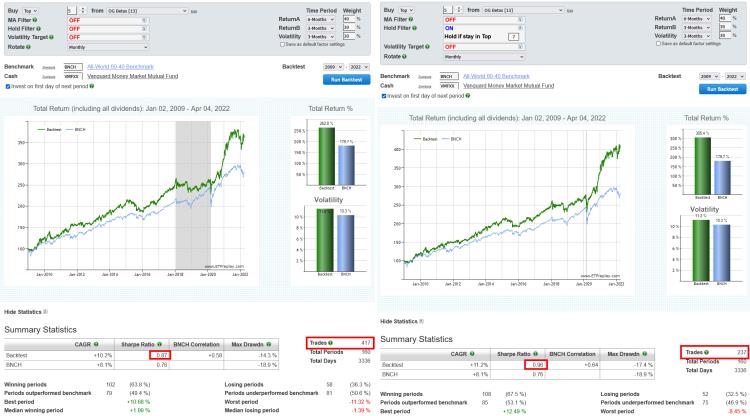
click image to view full size version
Note: the hold rank must be greater than the buy top / bottom number and be less than the number of securities in the chosen portfolio(s).
Feb 28, 2022
in Tracking Error
We have added a new tool that enables subscribers to see how closely the ETFs, stocks or mutual funds in their various lists track a given benchmark security.
Tracking error is the annualized standard deviation of the daily return difference between the security and the benchmark. i.e.
TE = StDev(daily total return - benchmark daily total return) x SQRT(252)
1% Tracking Error therefore means that, if returns are normally distributed, the security’s return will be within +/- 1% of the benchmark return 68% of the time and within +/- 2% of the benchmark 95% of the time.
Realized daily returns are obviously not perfectly normally distributed, so those probabilities are not to be taken literally, they are simply a rough guide. Nonetheless, tracking error provides an alternative perspective on risk from volatility and maximum drawdown.
A stock or ETF that has a persistently high tracking error will deviate substantially from the benchmark and is therefore unpredictable. This does not mean the security must automatically be excluded from the portfolio, but it would be prudent to set its position size accordingly.
Side note: The tracking error of a 2x leveraged ETF will be approximately the same as the volatility of its benchmark. i.e.
StDev (2x Daily Return - Daily Return) x SQRT(252) = StDev (Daily Return) x SQRT(252) = Volatility
SSO tracking error vs SPY ~= SPY volatility
QLD tracking error vs QQQ ~= QQQ volatility
etc.
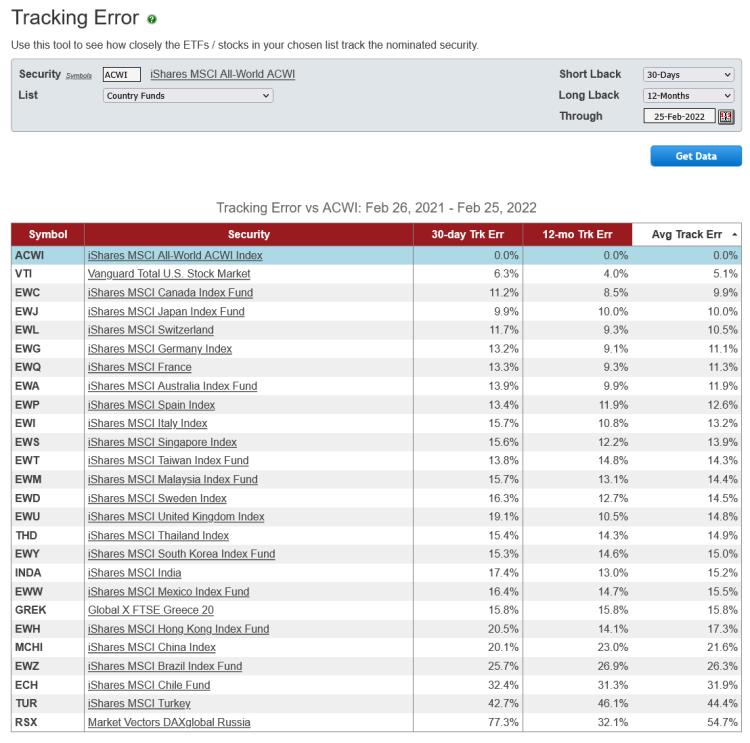
click image to view full size version
Go to the Tracking Error tool
Dec 09, 2021
in Relative Strength, Mean Reversion, Regime Change
This example employs a simple credit spread style ratio to define the prevailing risk on / off regime and uses that to switch between different strategies.
When the High Yield / Treasury ratio is trending upwards (i.e. short MA above long MA) the backtest pursues a mean-reversion strategy, investing in the weakest short-term performers (buying wholesale) in a list of broad U.S. equity ETFs.
Conversely, when the HYG / IEI ratio trends down (short MA below long MA), the backtest switches to a Relative Strength strategy; buying the top five from a list of mixed asset class ETFs. Selecting the strongest five securities from the list provides some diversification while also giving the backtest the opportunity, in bear markets, to allocate 80% to fixed income and, in the most severe periods, to avoid equities entirely.
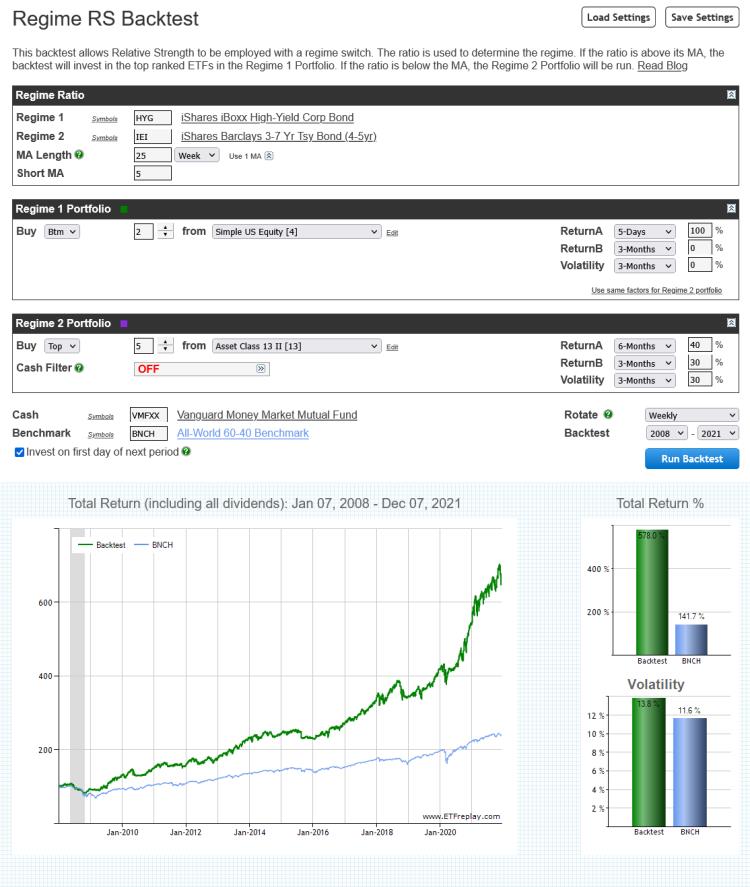
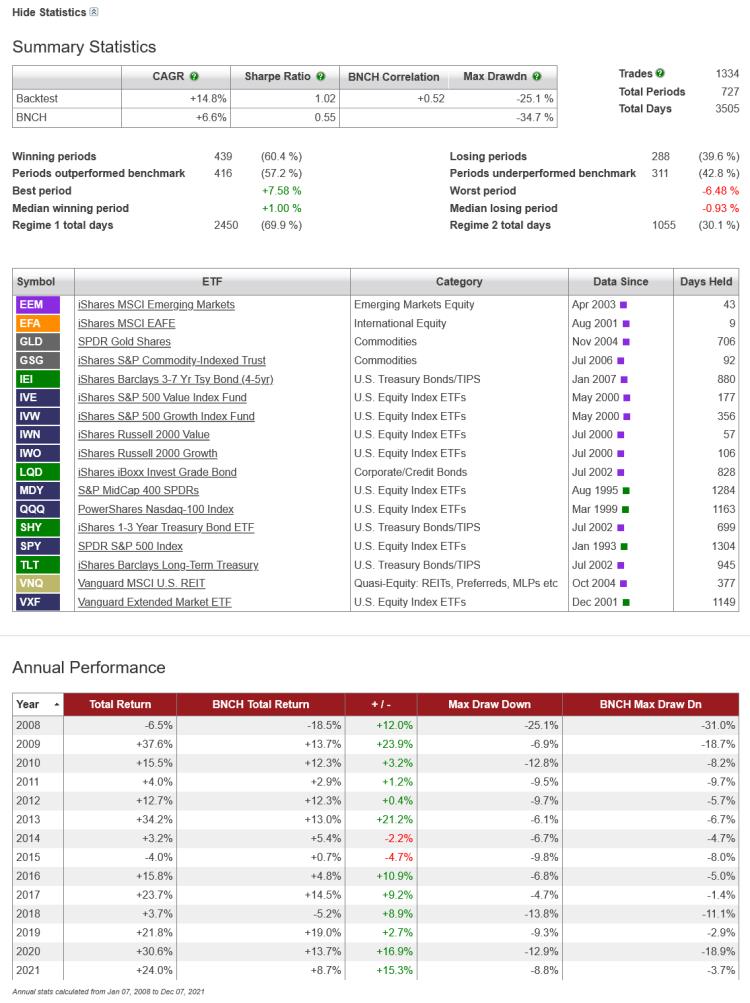
Specific parameters and ETFs are not the focus of this example, rather, it is intended to highlight the backtest functioanlity and to provide a starting point for subscribers to further research and develop.