Jan 03, 2023
in Total Return
2022 Total Return for the S&P-500 (both market-cap-weighted and equal-weight) and a selection of developed international and emerging market country funds.
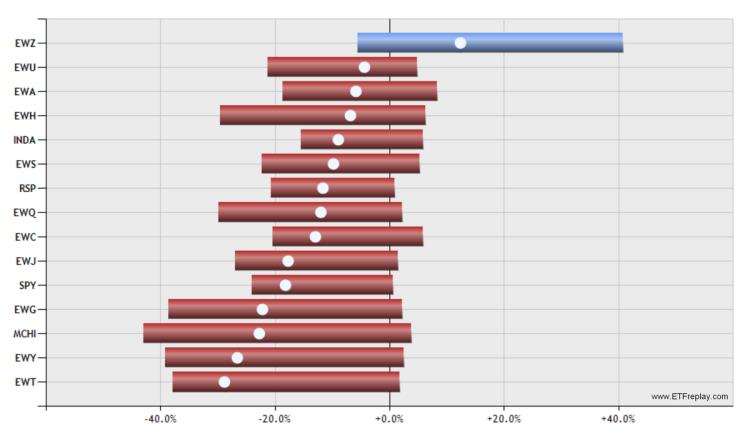
click image to view full size version
Dec 16, 2022
in Tracking Error
We have added some new functionality to the Correlation tool, Advanced RS Pro backtest and the My Portfolios page.
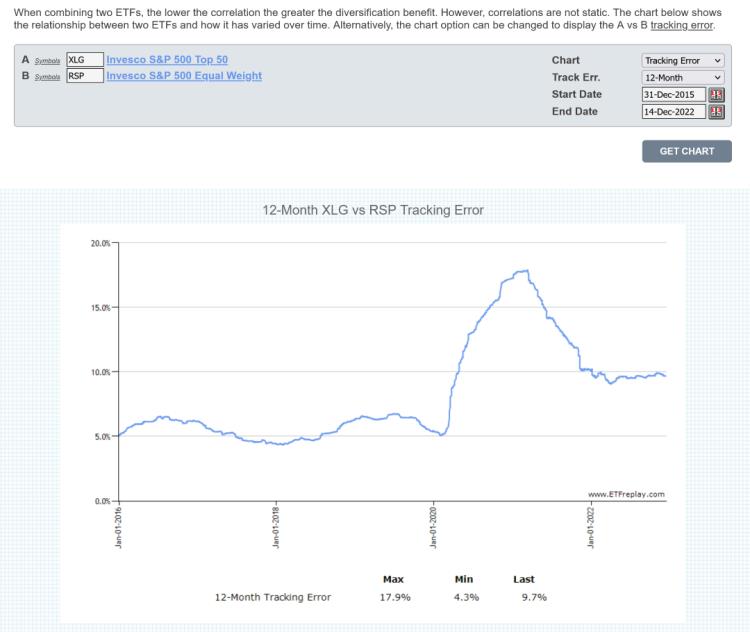
Correlation tool
There is now an option to change the chart to display the x-period Tracking Error, making it possible to see how closely security A has tracked security B and how that tracking has varied over time.
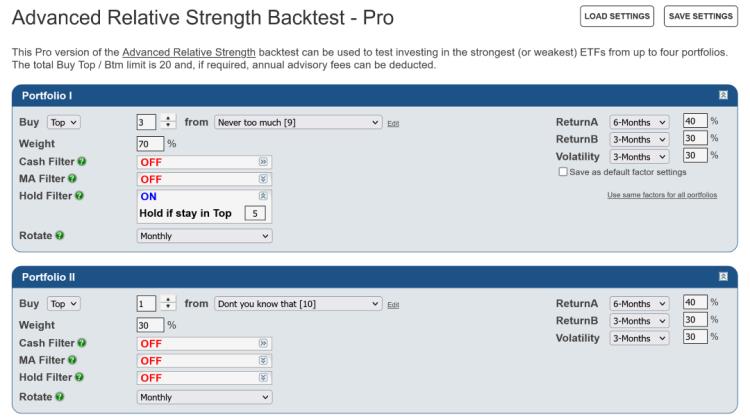
Advanced Relative Strength Pro
For Pro subscribers, the Hold Filter option is now available on each of the 4 portfolios of the Advanced RS Pro backtest.
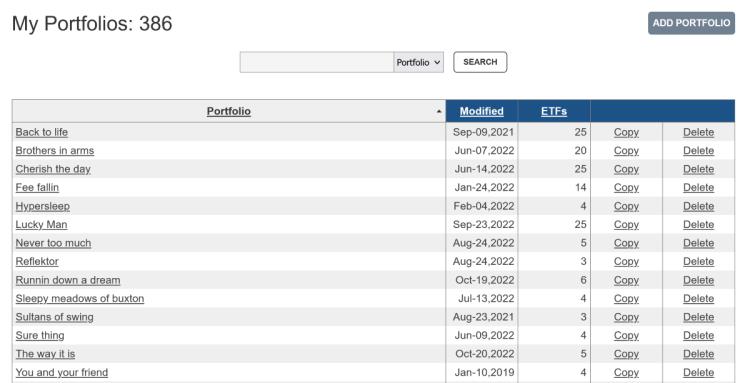
Portfolios
To assist subscribers that have a large number of portfolios, the My Portfolios table now has a date last modified column, which can be sorted. You can now also search for a portfolio by name, or find all your portfolios that contain a specific symbol.
Oct 20, 2022
in Moving Average, Channel
Trend following approaches, such as Moving Averages and Channels, preserve capital by cutting losses and as such they need sustained bear markets to outperform.
While they will generally capture the bulk of a bull market, the inherent lag means that a trend strategy can never sell at the high of an up move and can end up surrendering significant gains before exiting.
Consequently, outside of bear markets, the best they can do is to be fully invested and match the performance of the benchmark. However, bull market corrections and the short-lived directional moves of sideways markets mean that trend-following methods will inevitably suffer some whipsaw losses.
In other words, lengthy periods of underperformance should be expected in bull and range-bound markets. For those that can endure these mentally taxing and financially challenging periods, the pay off is the avoidance of major bear market drawdowns.
Below are a pair of backtests, a channel and a moving average, on a simple global 60/40 portfolio (VTI 35%, VGK 10%, VPL 10%, VWO 5%, AGG 30% and TIP 10%). Examination of the annual returns shows both the strengths and weaknesses of these trend following methods.
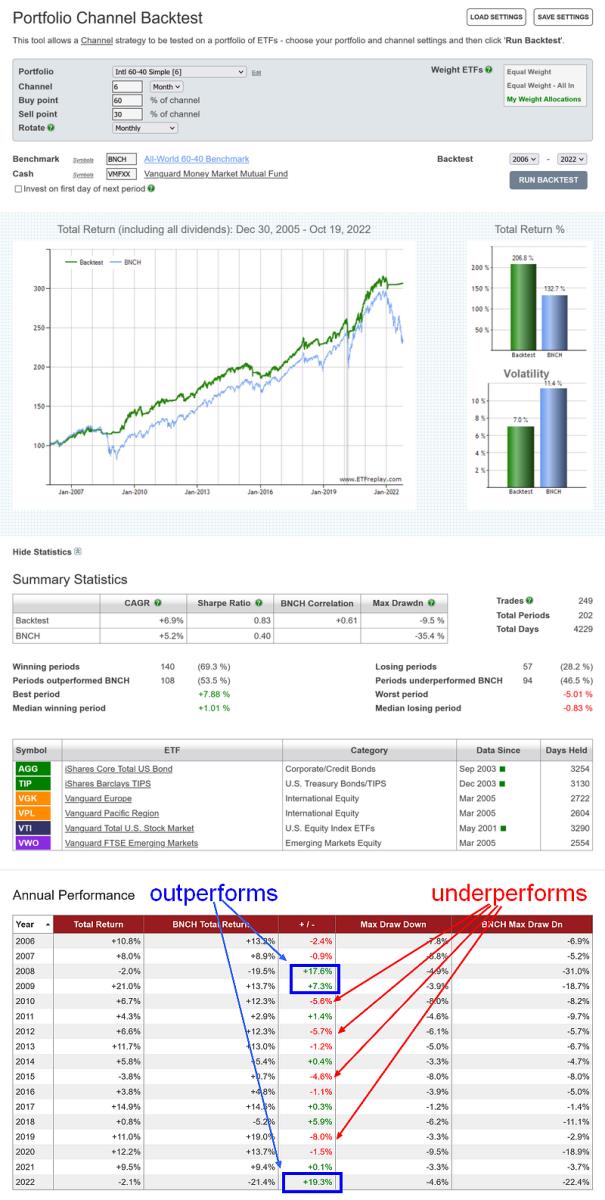
click image to view full size version
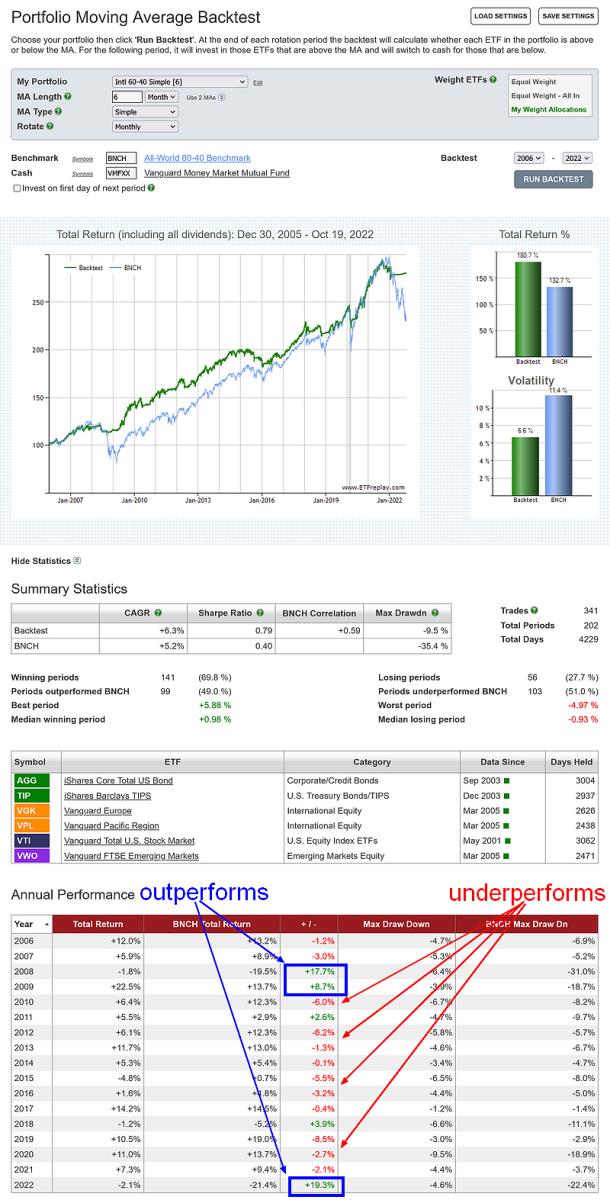
click image to view full size version
Portfolio Channel Backtest
Portfolio Moving Average Backtest
Sep 02, 2022
in Dashboards
We have added the following new options to dashboard window headers to make it easier and quicker to access related tools:
- C - click to open a new browser tab containing the Charts page that’s auto populated with both securities from the dashboard window
C appears above Ratio MA chart and TRD chart
- B - click to open a new browser tab with the relevant Backtest auto-populated with the securities / portfolio and parameters from the dashboard window
B appears above Ratio MA chart, MA chart, CHL chart, TRD chart and Ranks
- PS - click to open a new browser tab containing the Parameter Performance Summary that's auto-populated with the securities / portfolio and parameters from the dashboard window.
(note: Parameter Performance Summaries are available to annual subscribers, both regular and pro)
PS appears above Ratio MA chart, MA chart, CHL chart, TRD chart and Ranks.
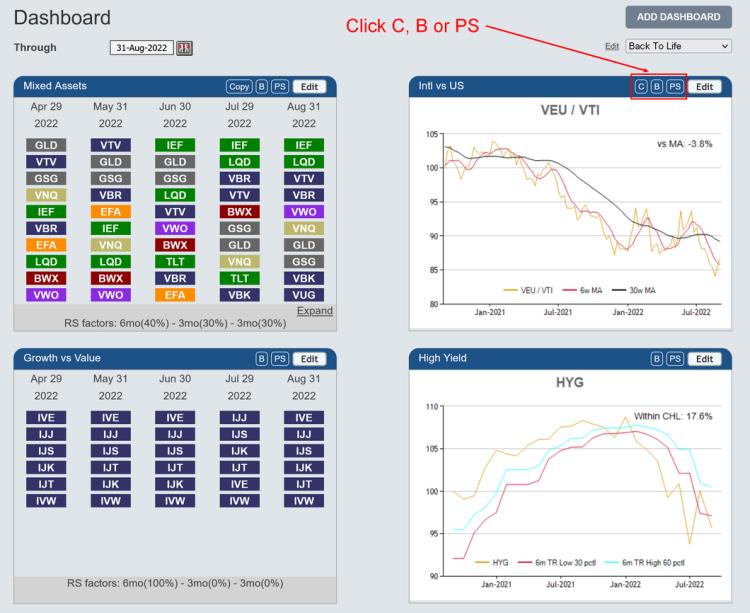
click image to view full size version
In addition, if all windows on a dashboard are TRD charts, a TRD Lookback drop-down-list now appears at the top of the page, beneath the ‘through’ date selector. This drop-down-list controls all the TRD charts on the dashboard, making it very easy to switch between lookback lengths.
By default it is set to 'Saved Value'; each of the TRD charts displays its own saved lookback length. If the drop-down-list is changed to 9-day, for example, then all the TRD charts on the dashboard will be recalculated and display a 9-day TRD. etc.
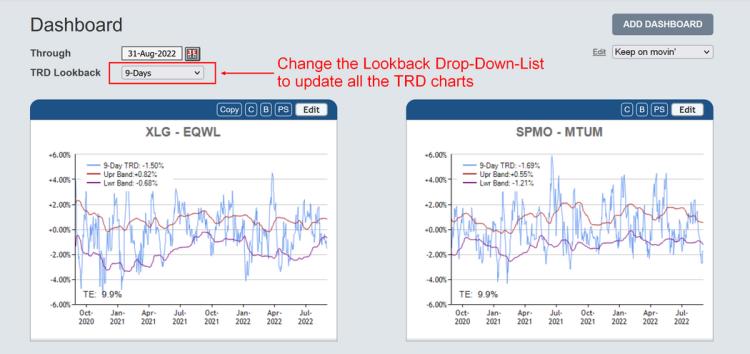
click image to view full size version
Aug 23, 2022
in Regime Change, Ratio
A question that we receive with some regularity is "can I run a backtest that changes strategy based on whether SPY is above or below its 200-day Moving Average?"
The answer is yes. We have a group of backtests that switch between strategies depending on the prevailing regime. These regime backtests build up on the logic of the Ratio MA backtest and come in 2 varieties:
With these two backtests, when the ratio is above its MA the backtest runs the Regime 1 portfolio / RS strategy (i.e. Risk On). Conversely, when the ratio is below its MA, the Regime 2 (Risk Off) portfolio is chosen.
If, rather than using a ratio, you want to switch strategy based on whether or not SPY alone is above / below its 200-day MA, then you can use XZERO as the Regime 2 security.
XZERO is simply a zero return index (i.e. it's a constant), so an MA of the ratio SPY / XZERO is the same as a moving average of SPY itself (see the Parameter Summary comparison at the bottom of this post).
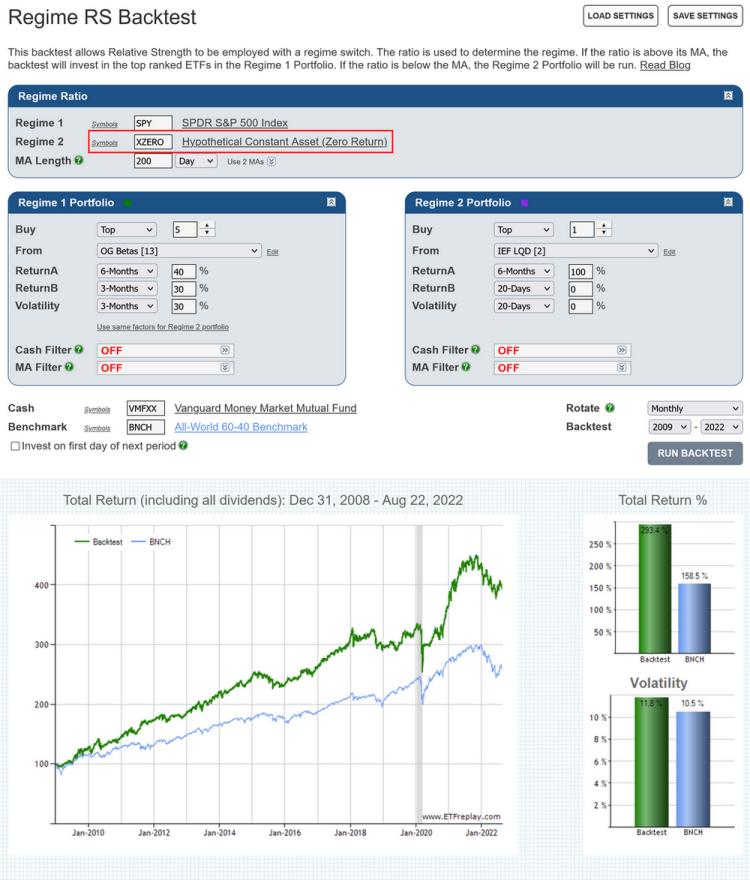
Regime RS backtest that uses the SPY 200-day MA to determine the regime
Note: Moving Averages on ETFreplay are calculated using Total Return. i.e. the calculation does not just use closing prices but also accounts for the receipt and reinvestment of any dividends and distributions. The MA is then compared to the Total Return value of the ETF, so that it's like-vs-like; everything is Total Return, not just price.
See:
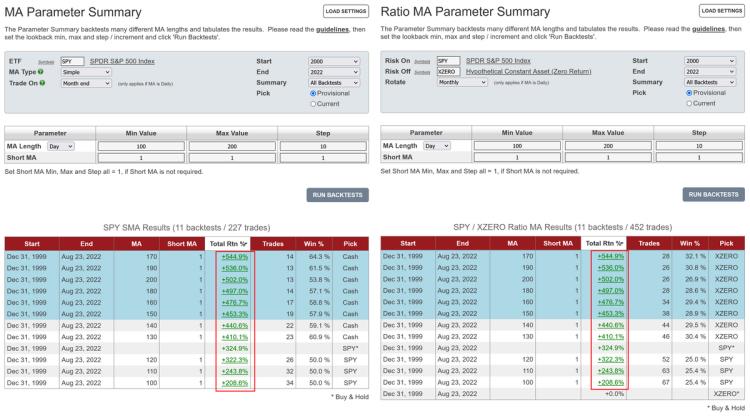
SPY MA Parameter Performance Summary on the left. SPY / XZERO Ratio MA Parameter Summary on the right. The backtest returns are the same.