Sep 08, 2023
With a Pro Subscription it is now possible to import your own data series for use with any tool or backtest on the website.

To import your own data, click on the new Import Data link and then create a series by clicking on the 'Add Data Series' button. Enter a ticker symbol (a $ prefix is added automatically to any imported series) and give your data series a name.
To add data to a series, simply click 'Import' and choose the Excel file that contains your data.
Note that:
- The Excel document must be a .xlsx file and the sheet must be named Sheet1 (no space) and contain 2 columns; Date and Value
- The data must be daily (U.S. trading dates only; non-valid dates will be ignored / omitted)
- The earliest allowable date is Dec-31, 1996
- The sheet should not contain any date gaps between the first date and the last date to be uploaded (other than market holidays and weekends)
- New data can be appended or backfilled, or existing data can be overwritten (see following note)
- Any existing data will be overwritten by newly uploaded data that has the same date

Up to 25 Imported Data series can be created and their symbols can be added to portfolios and therefore used with any backtest. Your Imported Data symbols are private; they can only be used by you. i.e. other subscribers cannot use them in charts or add them to a portfolio etc.
To edit or remove a series, click on its name in the Imported Data Series table.
Regular subscribers can upgrade to a Pro Subscription at My Account > Subscription Settings > Upgrade to Pro
Jul 28, 2023
in Drawdown, Parameter Summary
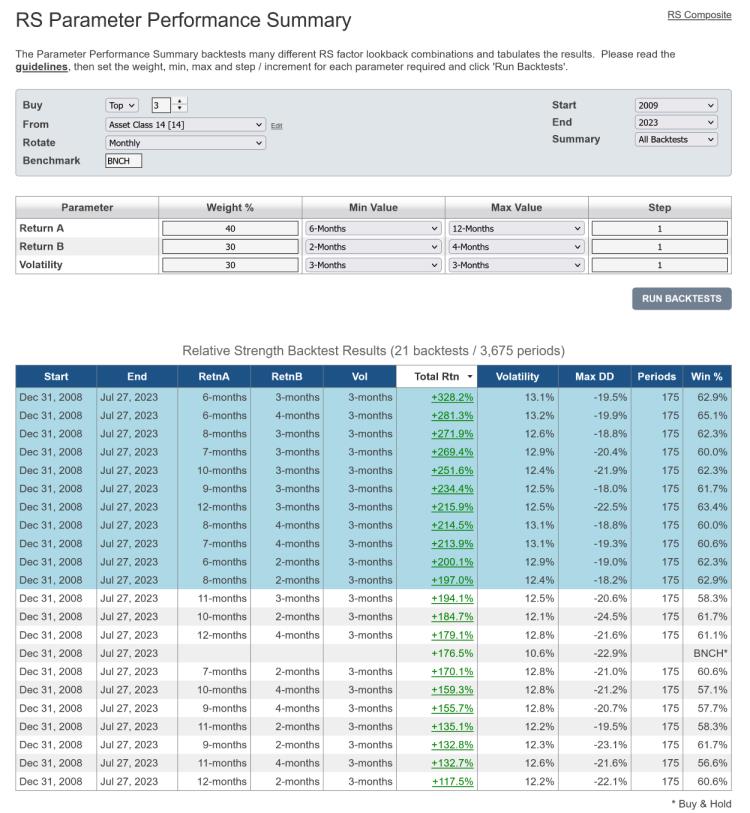
We have expanded the range of backtest statistics produced by the Parameter Performance Summaries with the addition of max drawdown.
The Parameter Performance Summaries make it possible to backtest numerous different parameter values in one go and assess the results. The table of backtest results is ordered by total return by default, but can now also be sorted by max drawdown (Max DD) as well as by win percentage, parameter value etc.
The Parameter Performance Summaries are available to both regular and pro annual subscribers:
As always, studying the guidelines that we published within the original Parameter Summaries announcement is highly recommended.
Mar 13, 2023
in Ratio
We have added a new composite version of the Ratio Moving Average backtest, which makes it possible to diversify across a range of MA lengths.
The Ratio MA backtest creates a ratio of the Total return value (not just price) of two securities; Risk On / Risk Off. The ratio will rise when the Risk On security outperforms the Risk Off security and fall when Risk-On underperforms.
The regular Ratio MA backtest invests in the Risk On security when the ratio is above its x-period moving average (i.e. the ratio is trending up) and switches to Risk Off when the ratio is below its MA.
The new Ratio MA Composite backtest reduces the risk of choosing a single MA length that, though it backtested well, turns out to perform poorly. For instance, rather than relying solely on a 6-month moving average, with the possibility that it underperforms in the future, the example below employs a range of moving average lengths from 3-month through 12-month with a step value of 1. This means that, each month, the backtest will compare the VUG / RSP ratio to its 3-month moving average, 4-month MA, 5-month, 6…11 and 12-month MA and invest 10% in the chosen security from each.

click image to view full size version
The step value can be changed to strike the desired balance between MA length diversification and real-world practicality. For instance, if the step value was increased to 2 in the above example, then the backtest would compare the VUG / RSP ratio to its 3-month, 5-month, 7, 9 and 11-month moving averages and invest 20% in the ETF resulting from each of those.
The composite can also be employed as a blended regime indicator using the weights displayed in the Backtest Trade History table.
The new Ratio MA Composite and the RS Composite backtest, which we introduced at the end of January, are available to all (regular and pro) annual subscribers.
notes:
- To see how each of the MA lengths performed individually, rather than as a composite, use the Ratio MA Parameter Performance Summary. The Parameter Performance Summary results can then be used to narrow the range between the min and max MA lengths.
-
If, rather than using a ratio, you want a backtest employing a range of moving average lengths on a single ETF, then you can use XZERO as the Risk Off security. XZERO is simply a zero return index (i.e. it's a constant), so an MA of the ratio ABC / XZERO is the same as a moving average of ABC itself. See Using SPY as a regime switch.
Feb 08, 2023
in Relative Strength, Video, Parameter Summary
Instructional video on how to use Composite Relative Strength to improve your ETF backtesting process. #STUDY
to expand video on screen, click the '4 expanding arrows' icon in the bottom right corner of the video screen. Use the settings icon to change to 1080 quality if it seems at all blurry
See also: RS Parameter Performance Summary
Jan 30, 2023
in Relative Strength
We have added a new backtest, Relative Strength Composite, which can protect against parameter choice misfortune by making it easy to diversify across a range of lookback values.
When relying solely on a single lookback period, though it may have backtested well, there's always the possibility that it may underperform in the future. The RS Composite backtest attenuates that risk by stepping through the return lookback periods, from your chosen minimum to maximum, and invests in the top (or bottom) x securities from each.
In the following example, the minimum length is 3-months, the maximum lookback is 12-months and the step value is 1. This means that, each month, the backtest will invest 10% in each of:
- Top security ranked by 3-month returns
- Top security ranked by 4-month returns
- …5-month returns
- …6-month returns
- …7-month returns
- …8-month returns
- …9-month returns
- …10-month returns
- …11-month returns
- Top security ranked by 12-month returns

click image to view full size version
The step value can be increased to assess whether it is possible to retain a significant degree of diversification without needing to employ every return length. For instance, raising the step value to 3 in the above example will mean that the backtest ranks the portfolio ETFs by 3, 6, 9 and 12-month returns each month and invests 25% in the top ranked security from each of those.
Watch video: How to use Composite Relative Strength
The Relative Strength Composite backtest is available to annual subscribers, both regular and pro.
Note:
- Just as a diversified portfolio means that some part of it will always be a drag, a composite of model variants will always underperform the single best version of a strategy....but it also avoids being exclusively in the worst.
- To see how each of the return lengths performed individually, rather than as a composite, use the RS Parameter Performance Summary