Category: Relative Strength
Sep 28, 2015
in Relative Strength
Approaching month / quarter end, none of the major asset classes are showing any strength relative to cash.

The only market with any shorter-term upside momentum (see Return B above) are U.S. Long Term Treasuries. For the bull case, TLT needs to hold above the June low. Failure to do so would turn the trend down.

Despite the recent sell-off in U.S. equities, the relative weakness of foreign stocks continues. We have been monitoring this for potential trend change, but there are no signs of that yet.

The usual caveats:
- This is a short example of the type of the analysis we do to assess market structure in order to take tactical positions. We favor diversification at the strategy level and any tactical positions form just a part of the whole.
- Probabilities play out in the long run, in the short term anything can happen.
- In no way should any of the above be considered investment advice.
Dec 11, 2014
in Relative Strength
User Question:
I run a portfolio relative strength backtest with 5 ETF but all are assigned an equal weight of 20%. How can I assign different weights to the ranked ETFs? Example: Top 5 Weighted as 30%, 30%, 20%, 10%, 10% respectively."
Answer:
For this you would use the Advanced Relative Strength Backtest (subscriber link).
By layering the strategies using different numbers of selections while at the same time using the same ETF list, you can create weightings based on Rank.
Note that the top two ranked securities in this portfolio list would each receive 10% from portfolio I, 10% from portfolio II and 10% from portfolio III. The backtest report combines weights and it becomes simply 30% for each of the two top ranked ETFs. Similarly, the 3rd ranked ETF received 10% from Portfolio II and 10% from portfolio III; making 20% in total. The 4th and 5th ranked ETFs are allocated 10% each by portfolio III.
Dive into the backtest report to see all the breakdown of sub-periods and the weightings of each ETF and its contribution to return for that period.

Jan 31, 2012
in Relative Strength
Q. "How do I test a strategy that combines the top relative strength ETFs from 2 or 3 separate portfolios?"
A. Create your chosen portfolios
Go to the Advanced Relative Strength Backtest, select your portfolios and choose your settings.
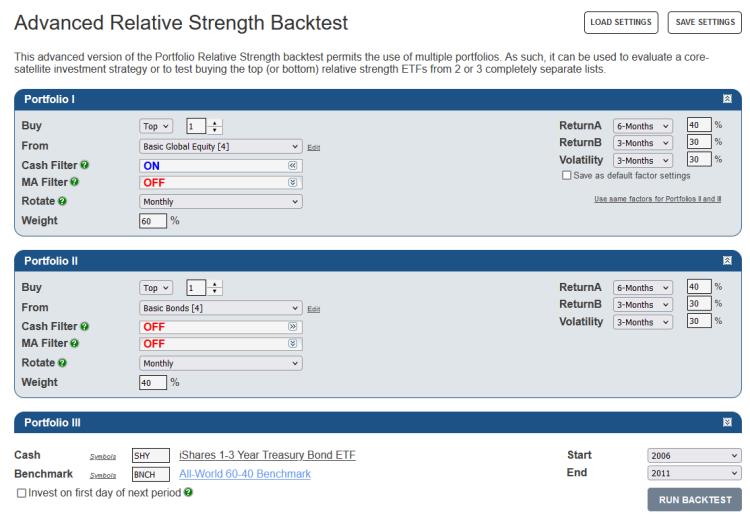
With the 'Cash Filter' ON, the top ETF(s) must be ranked above the cash ETF (SHY), otherwise the backtest will switch to that cash security.
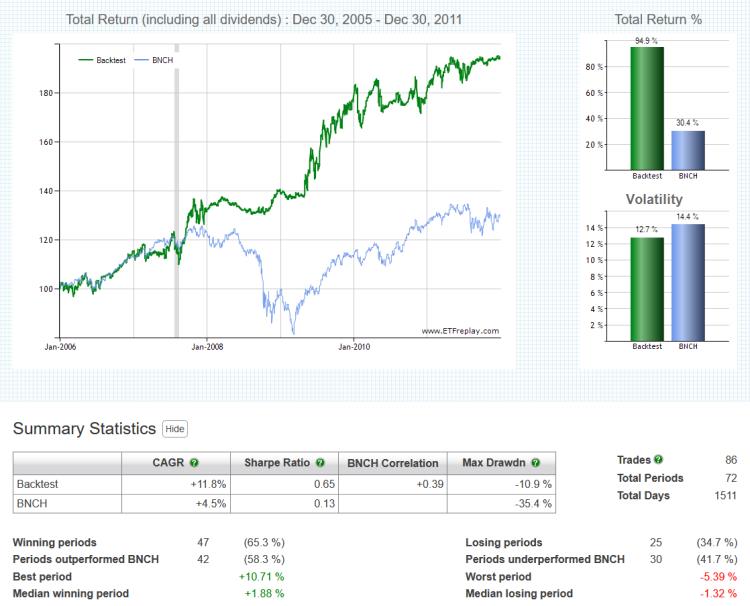
Click 'Run Backtest' and view the charts and summary statistics.
The 'Backtest Trade History' table displays the dates of all trades (entry and exit) and the performance of both the backtest and benchmark.
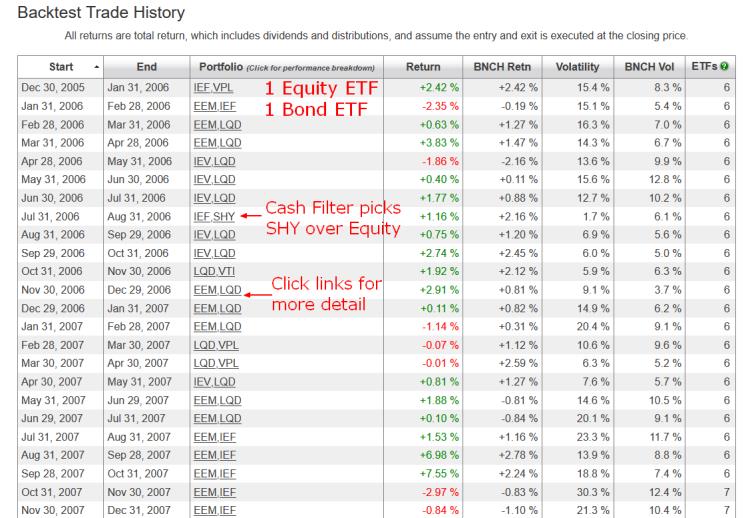
Click on the ticker symbols in the 'Portfolio' column of the 'Backtest Trade History' table for any period and a pop-up window will appear displaying the starting weight of each security and its return contribution.
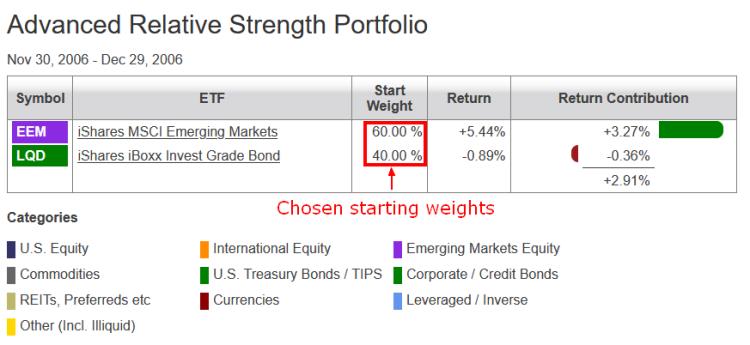
Please note that this is purely an illustrative example of one way to use the Advanced Relative Strength backtest and in no way does it constitute investment advice. The portfolios were chosen for information purposes only.
Jan 31, 2012
in Relative Strength
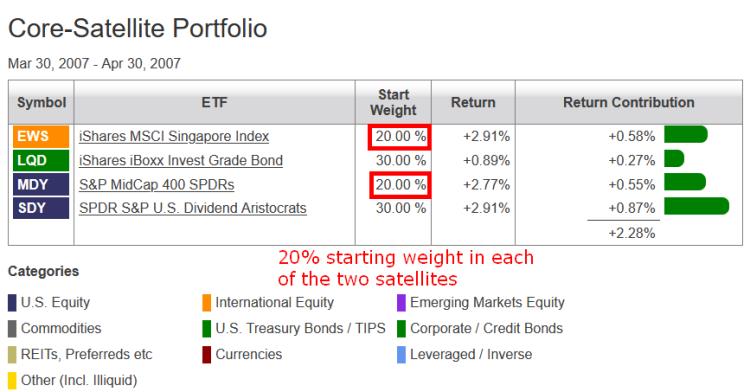
Q. "How do I test a strategy that combines a core portfolio with the top relative strength ETFs from one or two satellite portfolios?"
A. Create your chosen portfolios
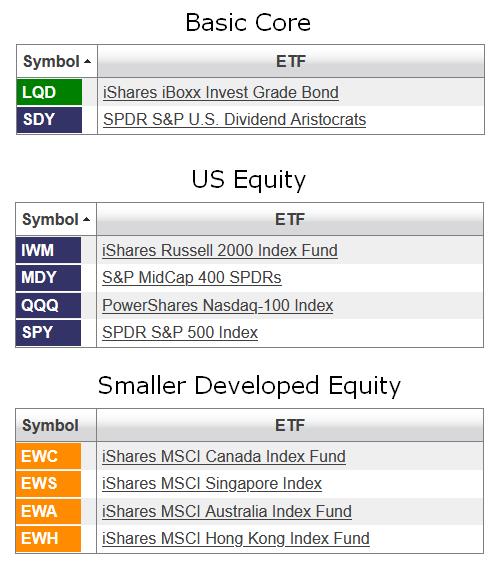
Go to the Core-Satellite Backtest, select your portfolios and choose your settings.
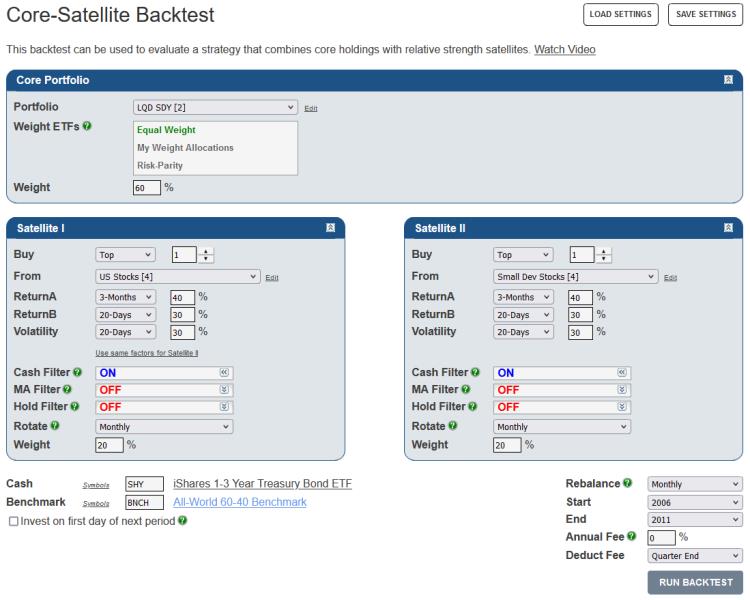
With the 'Cash Filter' ON, the top ETF must be ranked above the cash ETF (SHY), otherwise the backtest will switch to that cash security.
Click 'Run Backtest' and view the charts and summary statistics.
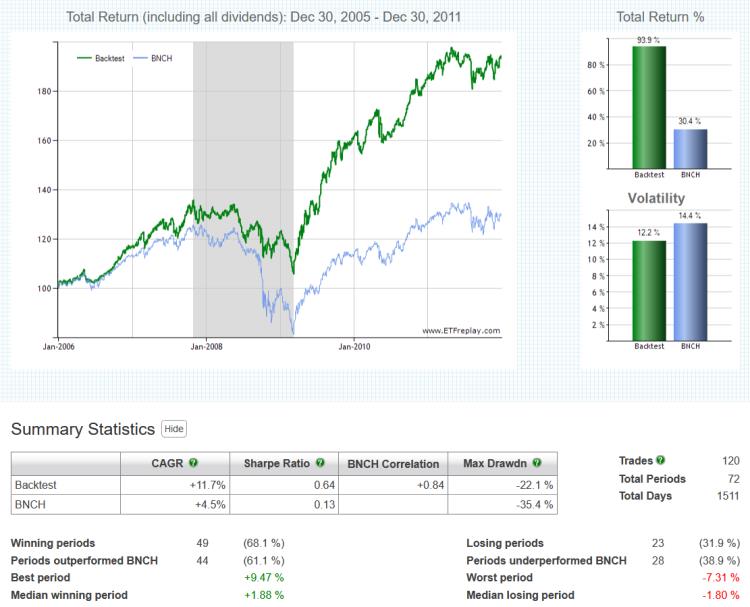
The 'Backtest Trade History' table displays the dates of all trades (entry and exit) and the performance of both the backtest and benchmark.

Click on the ticker symbols in the 'Portfolio' column of the 'Backtest Trade History' table for any period and a pop-up window will appear displaying the starting weight of each security and its return contribution
Please note that this is purely an illustrative example of one way to use the Core-Satellite backtest and in no way does it constitute investment advice. The portfolios were chosen for information purposes only.
Jan 11, 2011
in Relative Strength, Moving Average
We have added an optional moving average (MA) filter feature to the RS backtest app. With the recently expanded date start and stop functionality, the applications continue to get more versatile.
Combining a long-term moving average within the construct of relative strength has been highly requested and we wanted to discuss one idea when considering whether to use it (note that you can just leave it set to ‘off’ as well).
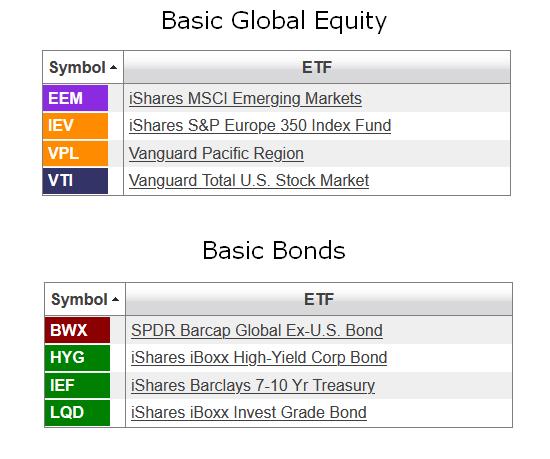
If you build a relative strength list of say 10 ETFs and you are choosing the top 2, you could protect your portfolio by including 2 bond funds. You don’t need a moving average filter because the bond funds will naturally be the ones with the relative strength when equity markets are dropping. This method actually can get more interesting because you can make better use of more type of ETFs. Rather than just use cash-like bond funds, you might want to extend the potential holdings to an intermediate bond fund like IEF (7-8 year duration) or others. You don't HAVE to restrict yourself to just stocks and cash.
Another way to test is by using a moving average. If you do it this way, then you will inherently be out of ETFs as they go into extended downtrends. You don’t have to proportionally keep X number of bond funds in your list if you do it this way.
But a lot of indexes can go above or below a long-term moving average and still not really be a source of market leadership and enhance your return. Moreover, you may save a lot of money between the time ETFs lose relative strength and the time they actually cross below the moving average. For these reasons, we believe adding relative strength to a MA strategy will generally be more robust. Adding MA to a RS strategy is optional -- and you may find works better or worse than your existing method. Continuous testing leads to better decisions.
